
After 12 months of live testing in 2019, let’s compare Flywheel vs SiteGround and find out which WordPress host has performed best.
Flywheel vs SiteGround – Testing Method
- Prior to testing, I have setup identical content on all 6 Live Test Sites
- Each week over 60,000 speed & uptime tests are run using independent tools, GTmetrix & Pingdom


- Test results below are from 07 Jan 2019 to 04 Jan 2020
Test #1: Speed
The GTmetrix Speed Test checks how long it takes for a website to fully load using a desktop internet browser. This test is then repeated every hour throughout the week (1,080 times).
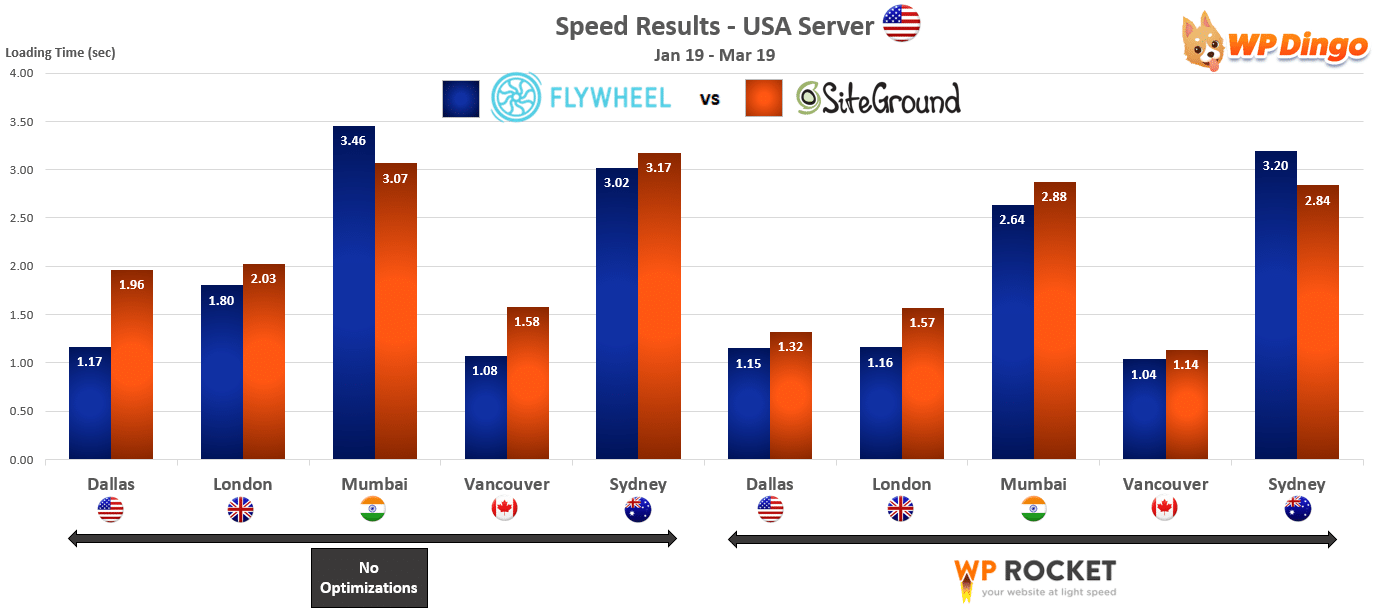
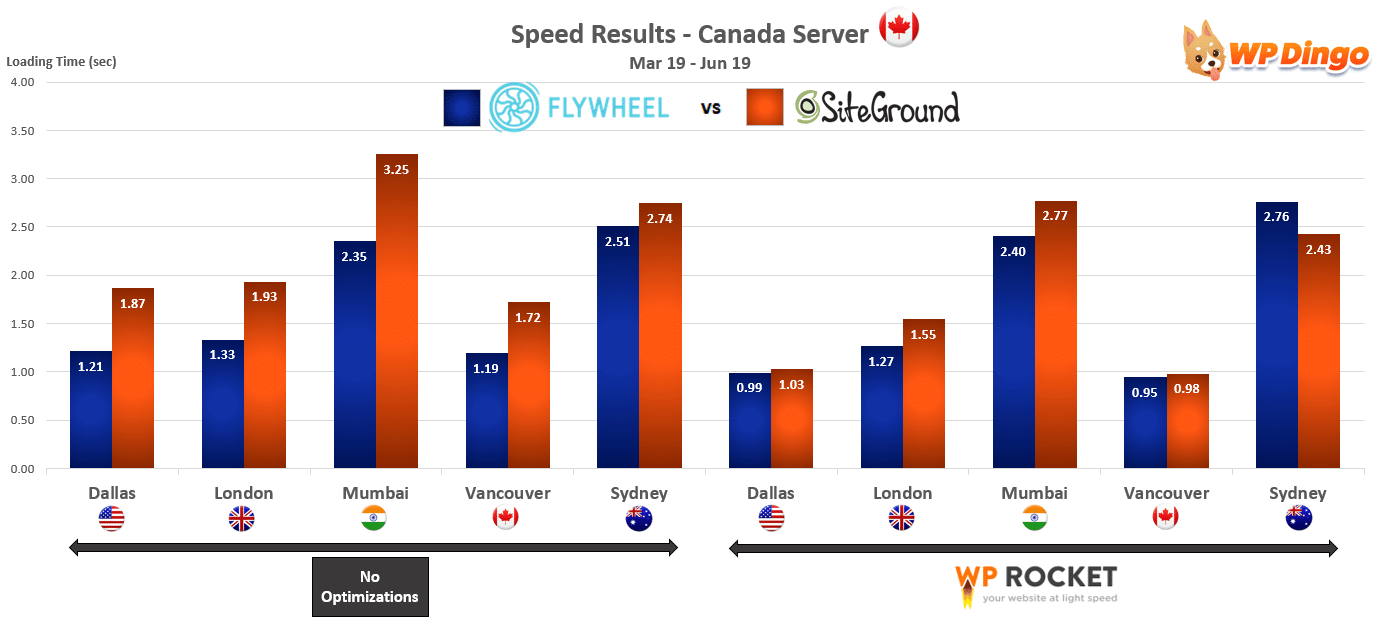
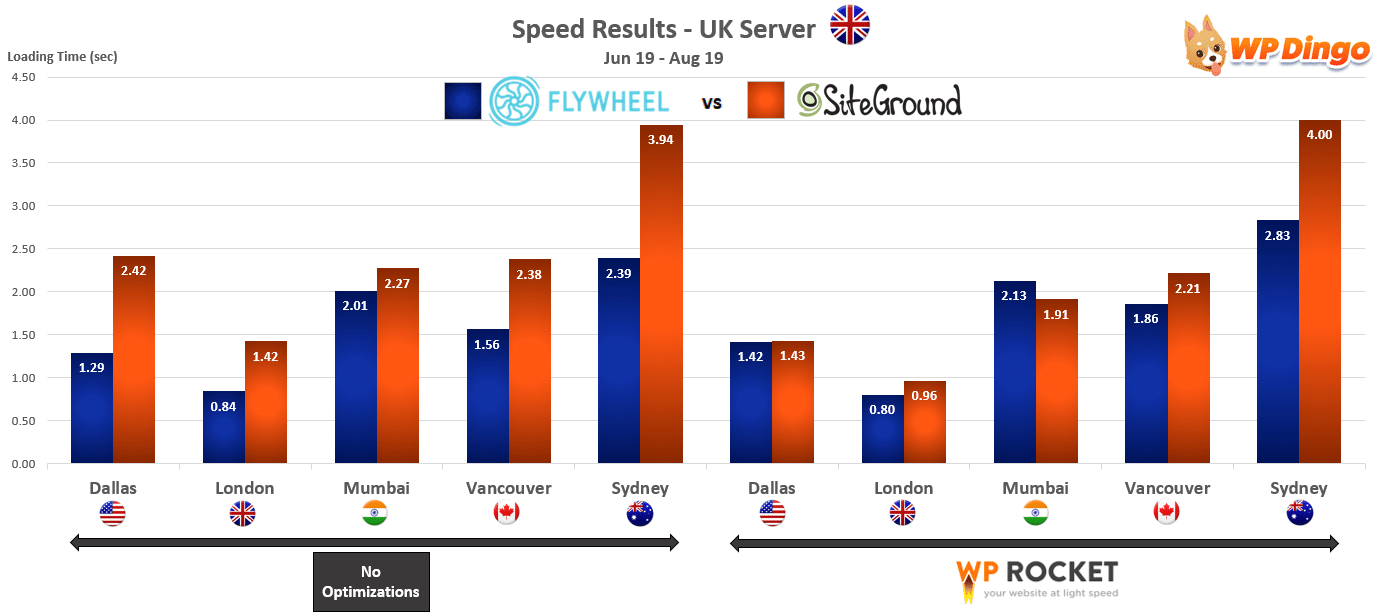
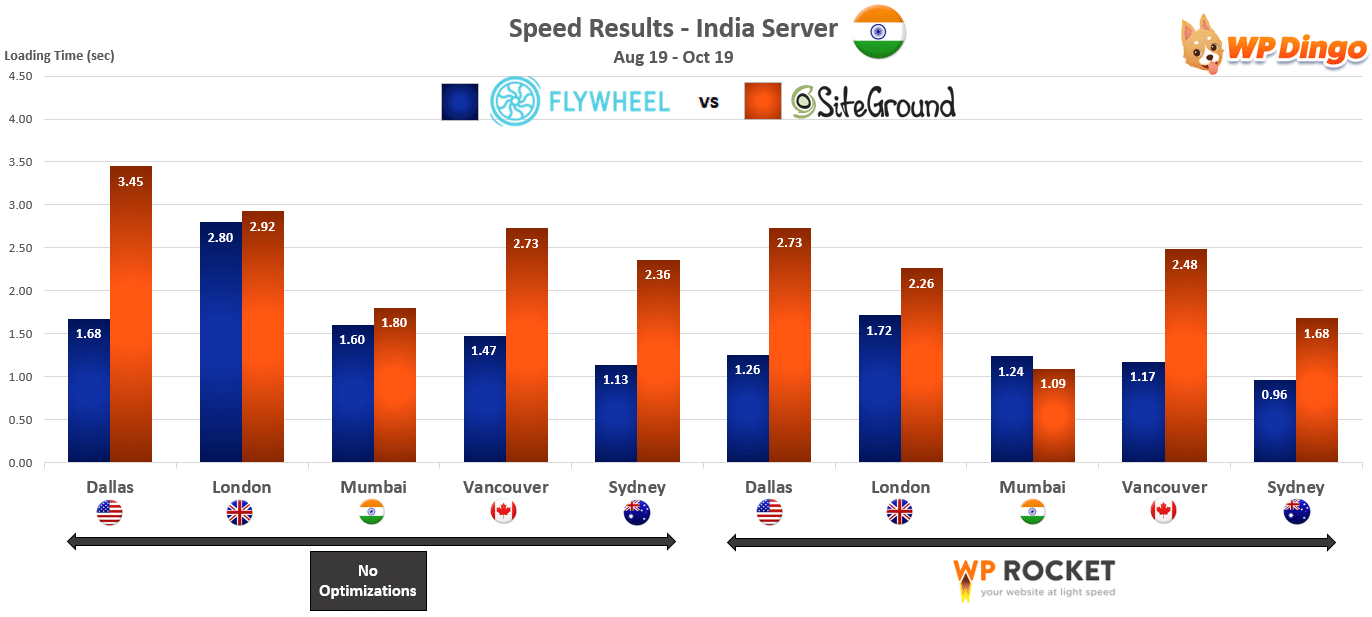
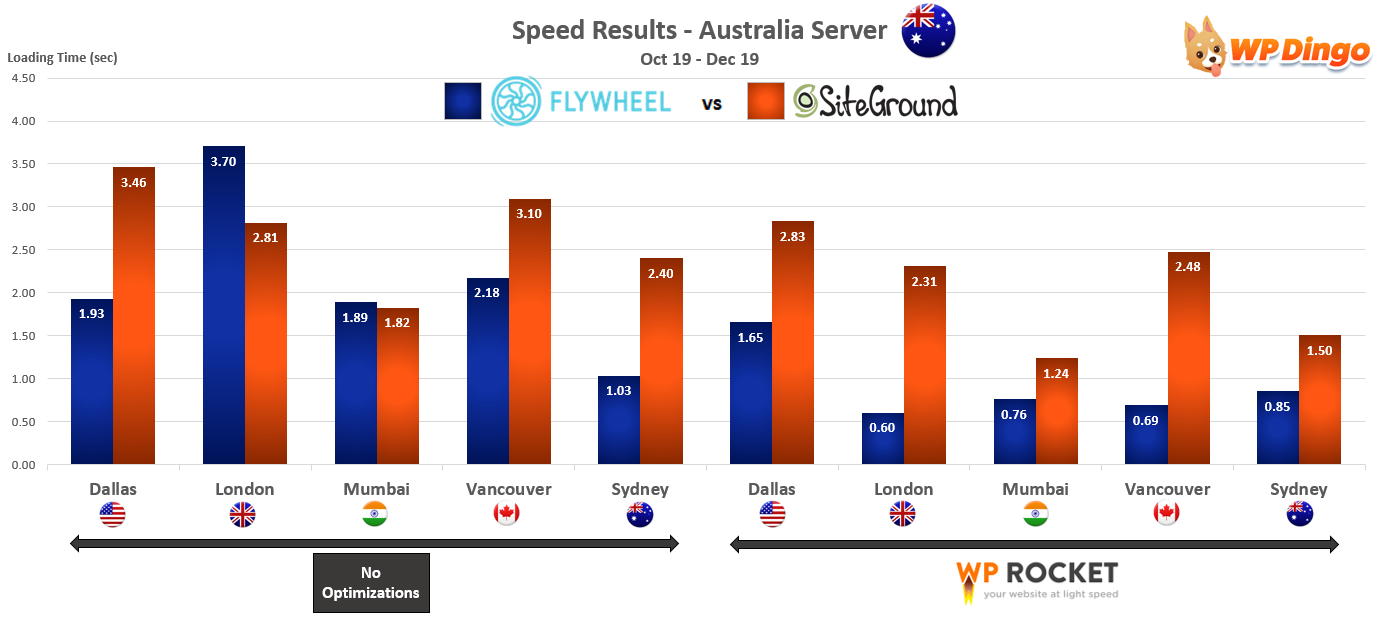
- Flywheel was solid in USA testing across Weeks 1 to 10 with a 3rd place finish. When we moved our servers to Canada & UK, Flywheel experienced a step improvement in speeds along with 2nd place finishes. Then in the latest results in India & Australia, Flywheel jumped up again to be the fastest host across Weeks 31 to 50.
- SiteGround’s speed started off very poorly, recording the slowest speed of all our hosts across the first 5 weeks of testing. The good news, however, was they were able to totally turn that around once WP Rocket was installed. They charged to 3rd during this time, outpacing 2 premium hosts in the process. A similar trend occurred across Weeks 11-50, with slow speeds initially then significant improvement with WP Rocket on board.
- Flywheel is currently in 2nd place, while SiteGround is 6th in our Speed Rankings.
2019 Results – USA Server
2019 Results – Canada Server
2019 Results – UK Server
2019 Results – India Server
2019 Results – Australia Server
View the Weekly Speed Tests
Test #2: Uptime
The Pingdom Uptime Test confirms that the website is actually accessible to visitors. This test is then repeated every minute throughout the week (60,480 times).
- The uptime performance for Flywheel across 50 weeks has been exceptional. With only 29 minutes of downtime across that time, they have successfully avoided long outages.
- The uptime results for SiteGround have been very impressive across the 1st 30 weeks of testing. The last 20 weeks have seen a bit of an increase in downtime. But having only recorded 58 minutes of downtime places them above some premium hosts and well above their budget host competitor in Lightning Base.
- Flywheel is sitting in 2nd place, with SiteGround 3rd in our Uptime Rankings.
View the Weekly Uptime Tests
Flywheel vs SiteGround – Overall ranking
The Overall Ranking accumulates the results from the speed & uptime tests to determine the #1 Host.
- Flywheel have recorded consistently impressive uptime throughout. And after a solid start with their speed results early in 2019, things have really taken off in the last 45 weeks, consistently taking out top 3 finishes. Being the fastest host in India & Australia has propelled Flywheel into the coveted #1 ranking.
- SiteGround’s uptime performance has been impressive, while some improvement is needed to their speed to move up the rankings. They are ahead of Lightning Base in the preferred budget host category, and not far off the performance of some of the premium hosts, especially when their speed with WP Rocket results are isolated.
- Flywheel is currently 1st and SiteGround is 4th in our Overall Rankings.








 Hi, I'm Clint!


