
Let’s hit the road to find out how fast our hosts have been this week in Sydney?
Desktop Speed Test – Week 27 Method
- Compare 8 WordPress Hosts
- Use 8 Live Sites, each with a Different Host but with Identical Content (you can check them out here)
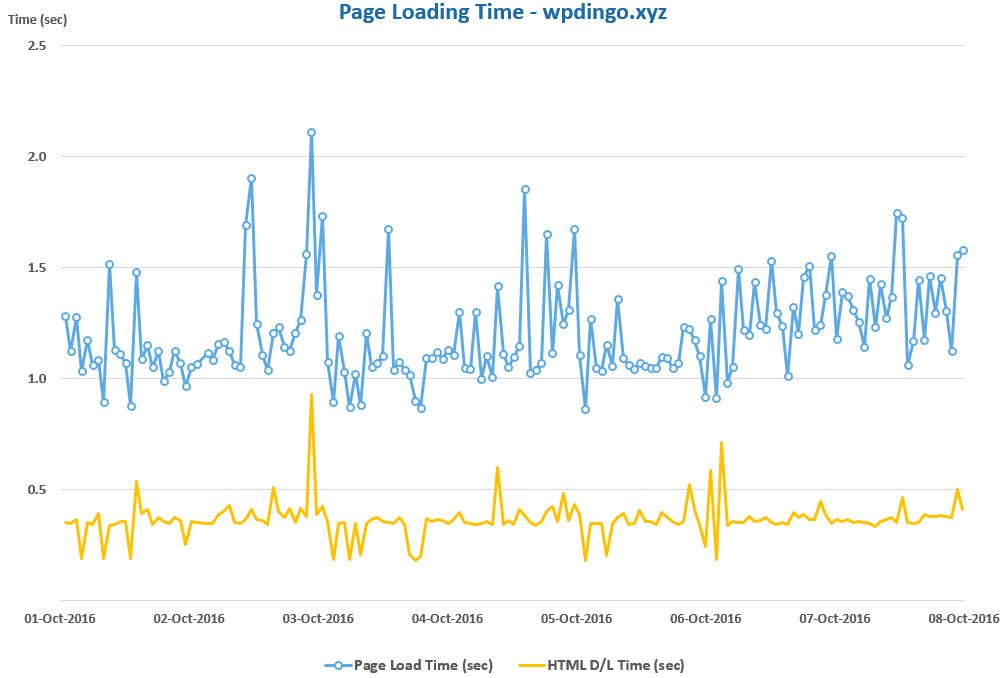
- Use GTmetrix Speed Test
![]()
- Location of Test: Sydney, Australia
- Frequency of Testing: Every Hour for 7 Days
- Number of Weekly Tests = 1 x24 x7 x8 = 1,344 (xHours xDays xSites)
- Desktop Speed Testing is checking how long it takes for a website to fully load using a desktop internet browser
Which WordPress Host will conquer the Desktop Speed Test this week?
WordPress Hosts
Identical Live Sites
Weekly Tests
WordPress Host #1: SiteGround
WordPress Host #2: A2 Hosting
WordPress Host #3: GoDaddy

WordPress Host #4: DreamHost
WordPress Host #5: InMotion Hosting
WordPress Host #6: HostGator

WordPress Host #7: Bluehost
WordPress Host #8: Web Hosting Hub

Desktop Speed Test – Week 27 Summary Table
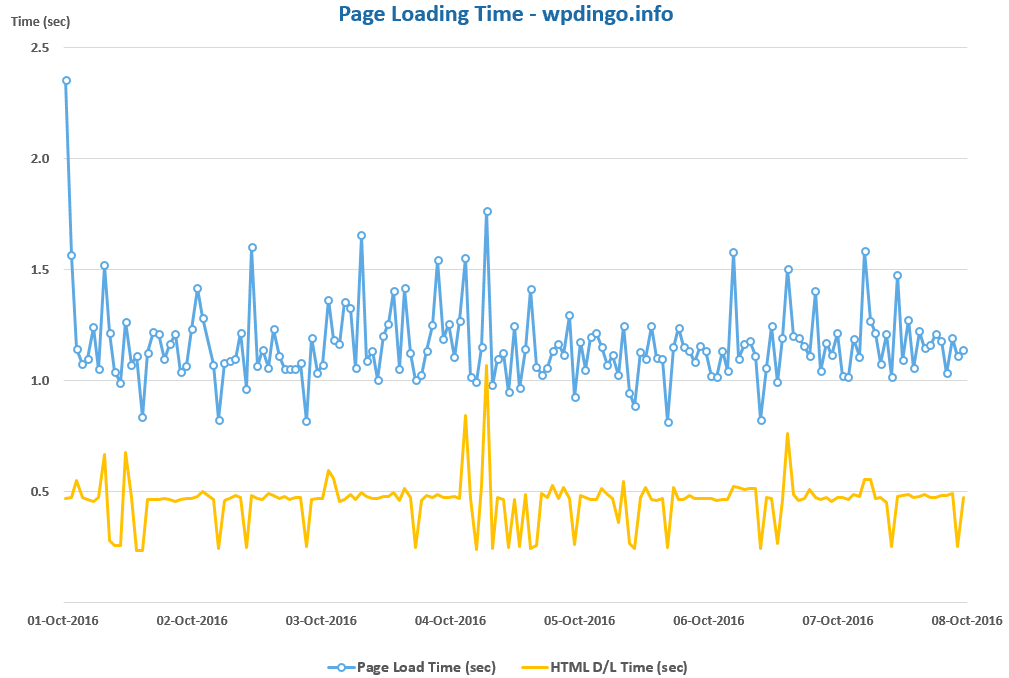
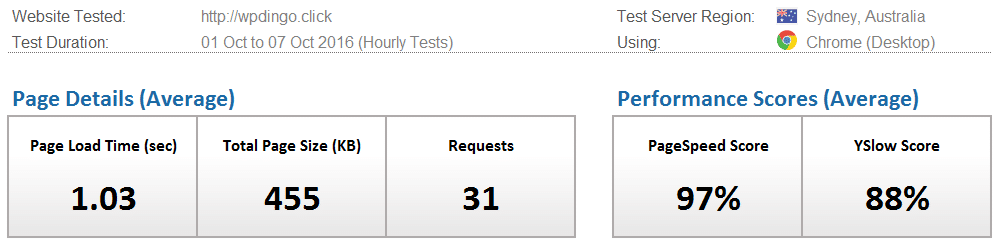
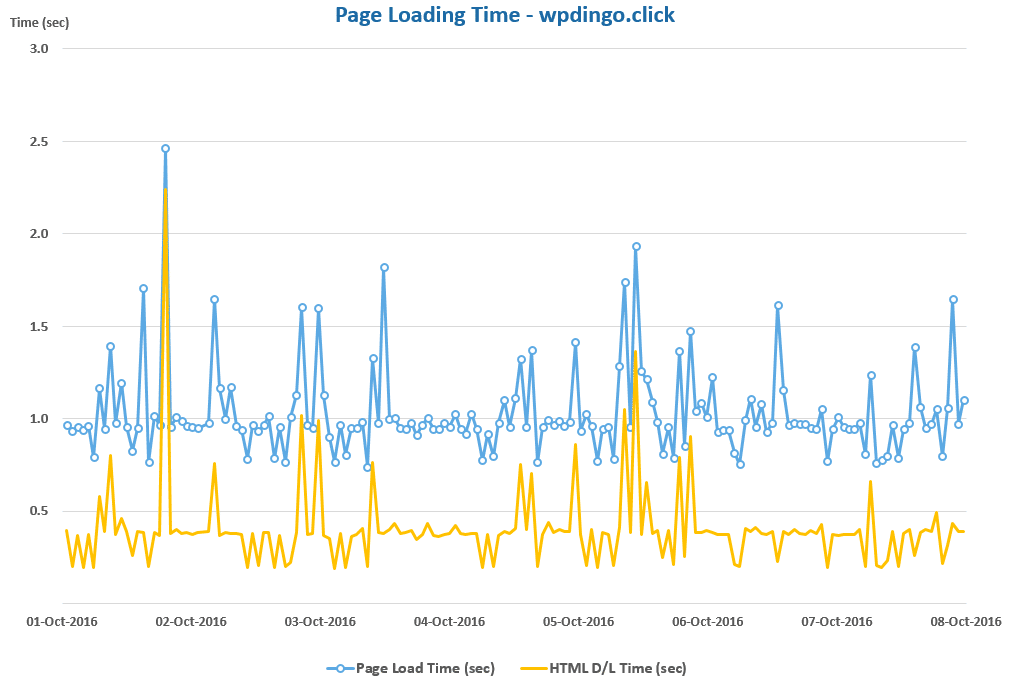
The winner this week is Bluehost with a time of 1.03s, which has smashed the previous Sydney record set by GoDaddy of 1.32s in Week 23.
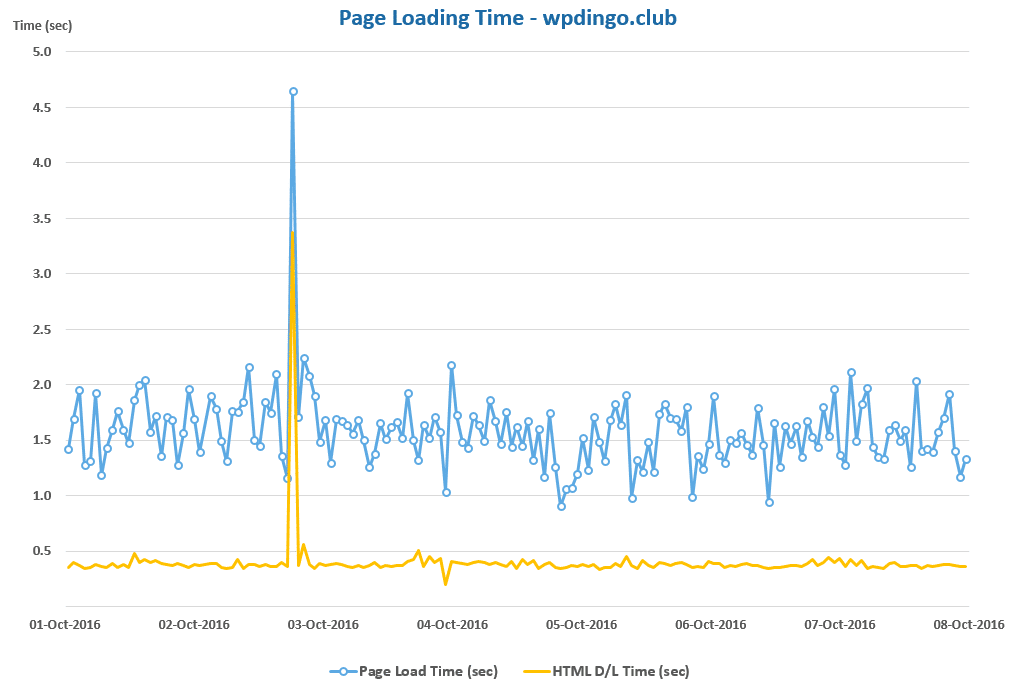
On our last visit to Sydney with KeyCDN setup (in Week 23), the average page load time for our 8 hosts was 1.67s. This week with CloudFlare, the average load time has improved significantly to 1.38s. So the early points in this CDN showdown goes to CloudFlare. I wonder whether this trend will continue over the next 3 weeks of testing in our Speed Study on CloudFlare?
Next week we are off to Vancouver where the record load time is 0.81s, set by InMotion Hosting. Will we see yet another record get set?

And the Week 27 Winner is…
![]()
Desktop Speed Rankings
After 26 weeks of testing, I think it’s time to summarize all the results to see how our 8 hosts are performing overall. It will also allow us to find out which host is currently leading our desktop speed challenge.


 Hi, I'm Clint!


