
Which host will clock the fastest time in Sydney this week?
Desktop Speed Test – Week 19 Method
- Compare 8 WordPress Hosts
- Use 8 Live Sites, each with a Different Host but with Identical Content (you can check them out here)
- Use GTmetrix Speed Test
![]()
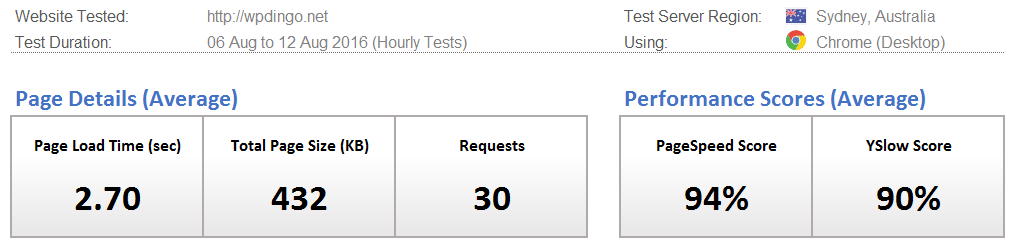
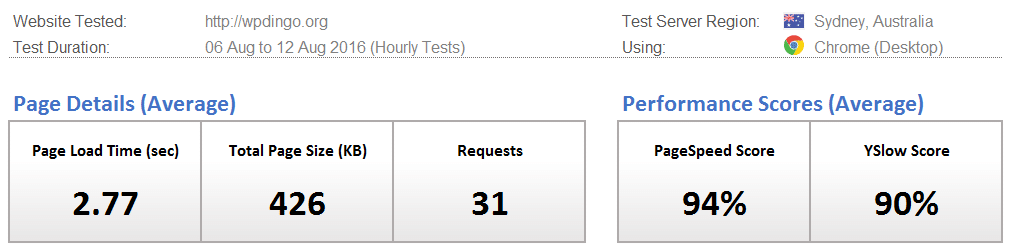
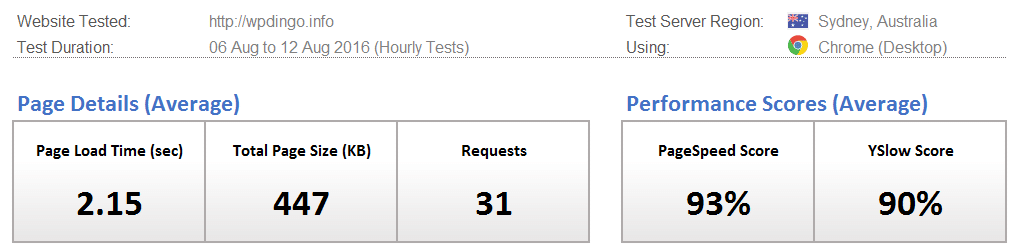
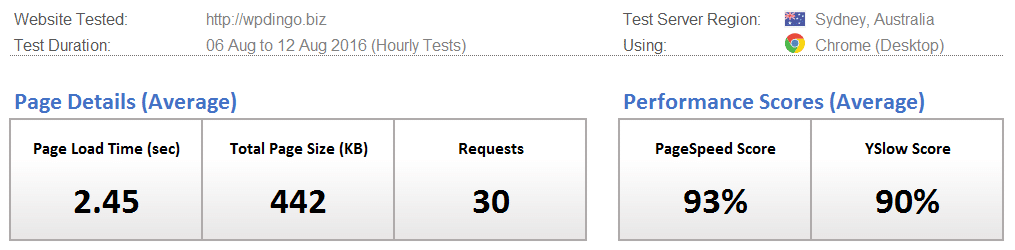
- Location of Test: Sydney, Australia
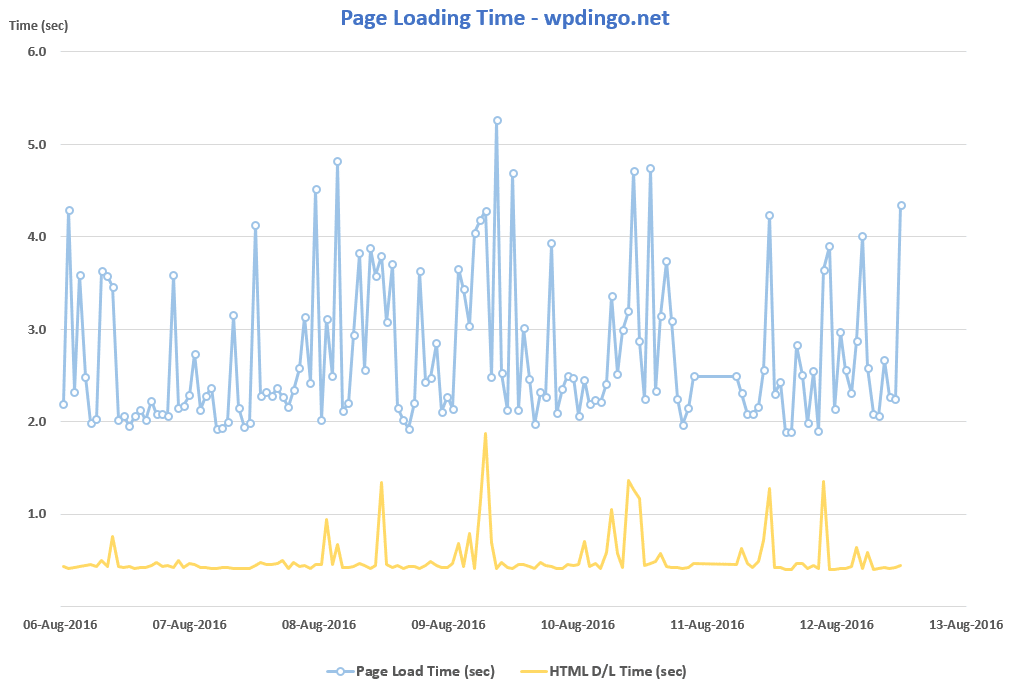
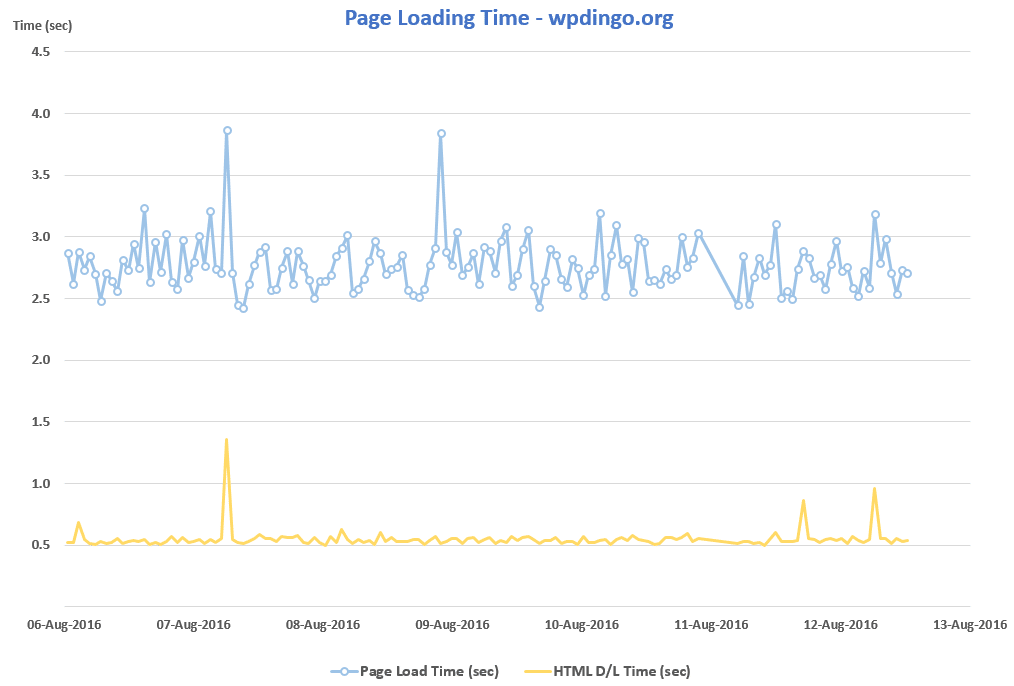
- Frequency of Testing: Every Hour for 7 Days
- Number of Weekly Tests = 1 x24 x7 x8 = 1,344 (xHours xDays xSites)
- Desktop Speed Testing is checking how long it takes for a website to fully load using a desktop internet browser
Which WordPress Host will conquer the Desktop Speed Test this week?
WordPress Hosts
Identical Live Sites
Weekly Tests
WordPress Host #1: SiteGround
WordPress Host #2: A2 Hosting
WordPress Host #3: GoDaddy
WordPress Host #4: DreamHost
WordPress Host #5: InMotion Hosting

WordPress Host #6: HostGator

WordPress Host #7: Bluehost
WordPress Host #8: Web Hosting Hub
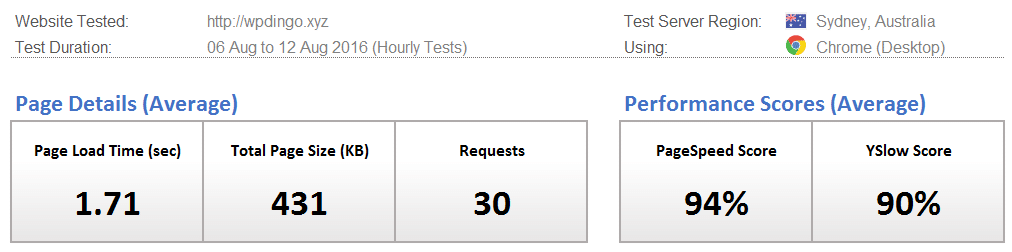
Desktop Speed Test – Week 19 Summary Table
Web Hosting Hub and InMotion Hosting were consistently 1st & 2nd in the 4 weeks with W3 Total Cache, and that trend seems to be continuing with WP Rocket now installed.
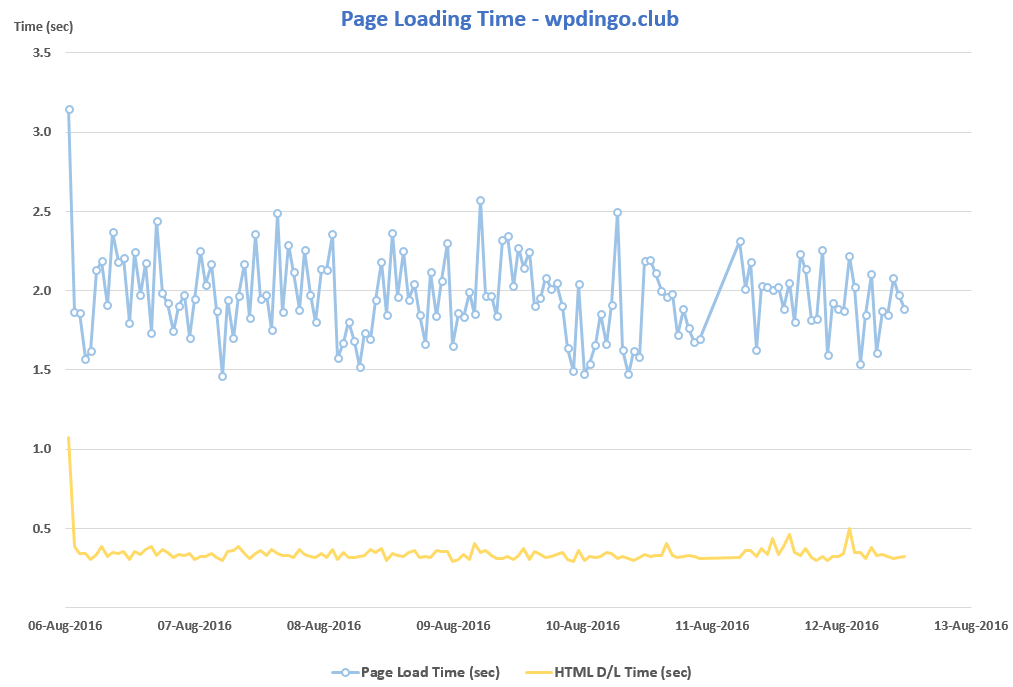
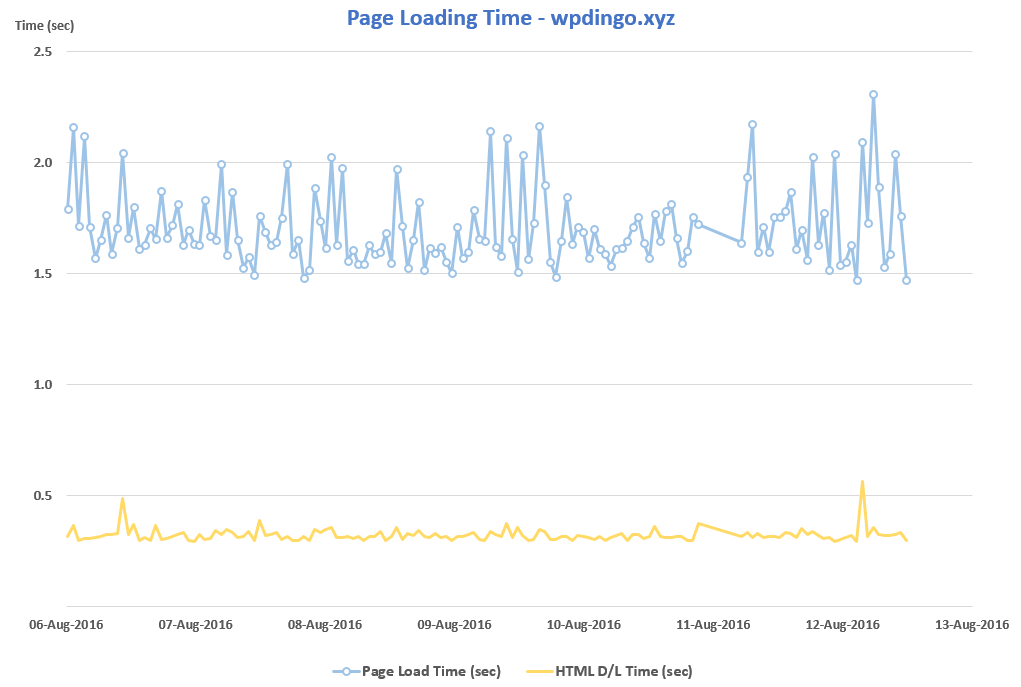
The winner this week in Sydney is Web Hosting Hub with an impressive time of 1.71s. This is just behind the Sydney record of 1.67s (which was also set by Hub).
And the last time we visited Sydney with W3 Total Cache setup (in Week 15), the average page load time for our 8 hosts was 2.32s. This week with WP Rocket on board, the load time has dropped slightly to 2.26s. This contest between W3 Total Cache and WP Rocket looks to be a close one – lucky we have 3 more weeks before declaring the winner!!
Next week we are off to Vancouver where the all time record was set at 0.81s. This will be very hard to break, can any of our hosts get close?

And the Week 19 Winner is…
![]()
Desktop Speed Rankings
After 19 weeks of testing, I think it’s time to summarize all the results to see how our 8 hosts are performing overall. It will also allow us to find out which host is currently leading our desktop speed challenge.


 Hi, I'm Clint!


