
Which of our hosts are kicking it into top gear this week in London?
Desktop Speed Test – Week 43 Method
- Compare 8 WordPress Hosts
- Use 8 Live Sites, each with a Different Host but with Identical Content (you can check them out here)
- Use GTmetrix Speed Test
![]()
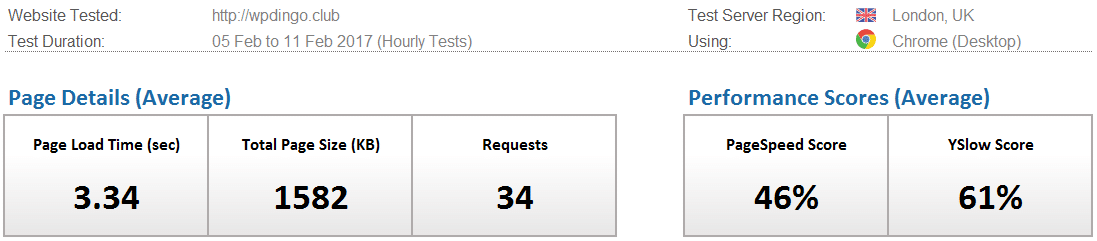
- Location of Test: London, UK
- Frequency of Testing: Every Hour for 7 Days
- Number of Weekly Tests = 1 x24 x7 x8 = 1,344 (xHours xDays xSites)
- Desktop Speed Testing is checking how long it takes for a website to fully load using a desktop internet browser
Which WordPress Host will conquer the Desktop Speed Test this week?
WordPress Hosts
Identical Live Sites
Weekly Tests
WordPress Host #1: SiteGround
WordPress Host #2: Namecheap
WordPress Host #3: GoDaddy
WordPress Host #4: DreamHost
WordPress Host #5: InMotion Hosting
WordPress Host #6: HostGator
WordPress Host #7: Bluehost
WordPress Host #8: Web Hosting Hub

Desktop Speed Test – Week 43 Summary Table
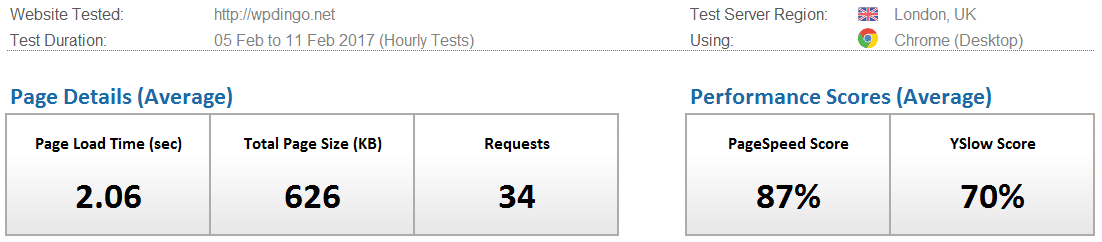
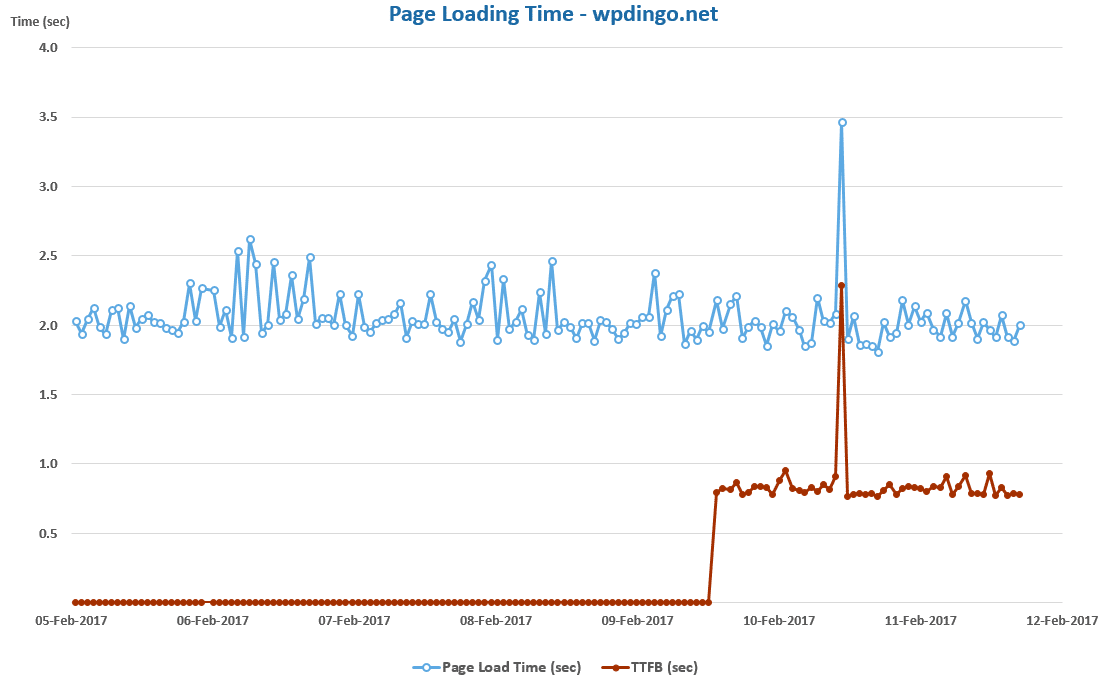
The winner this week is SiteGround with a time of 2.06s. This time is a fair way behind the London record of 0.92s set by DreamHost in Week 30.
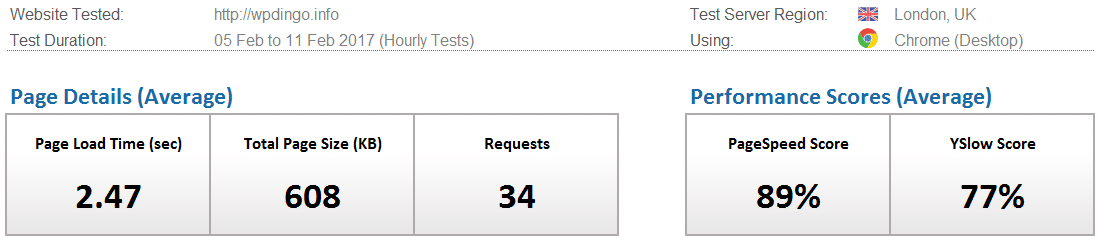
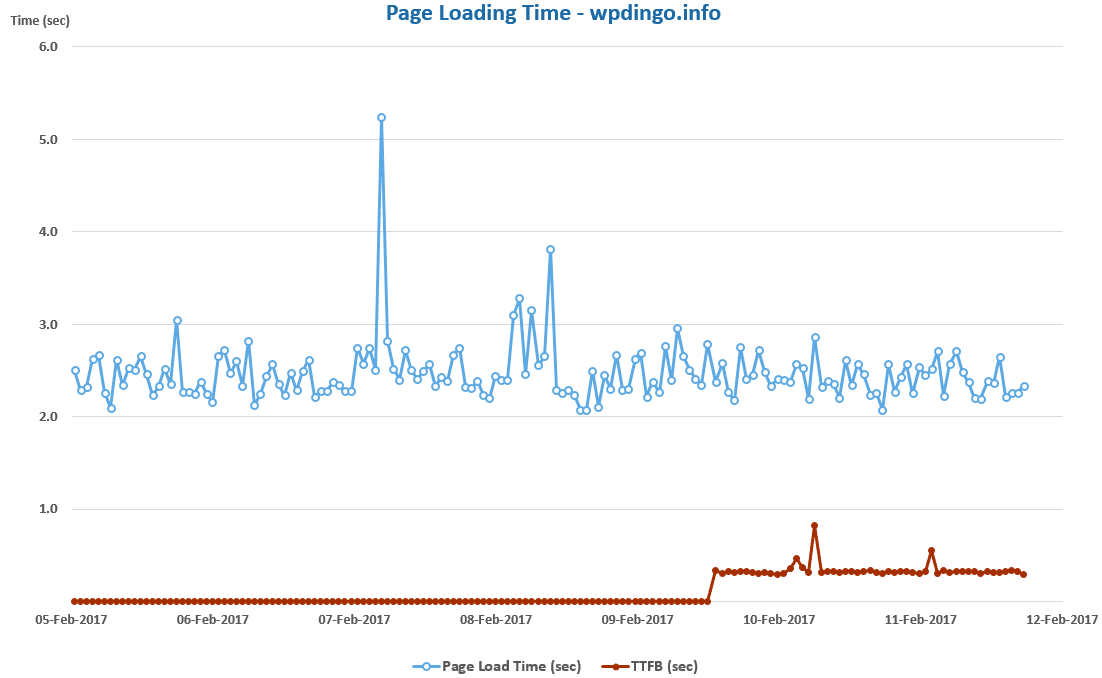
On our last visit to London with No Optimizations setup (in Week 40), the average page load time for our 8 hosts was 2.95s. This week with Imagify added, the average load time is slightly slower at 3.09s.
This is the second week of our Imagify Speed Study and it’s not looking overly promising for Imagify from a speed perspective.
Will it turnaround next week in Sydney, where the record load time is 1.03s, set by Bluehost in Week 27.

And the Week 43 Winner is…
![]()
Desktop Speed Rankings
After 9 months of testing, let’s summarize all the results to see how our 8 hosts are performing overall. It will also allow us to find out which host is currently leading our desktop speed challenge.


 Hi, I'm Clint!


