
With W3 Total Cache installed, let’s see which hosts are out in front this week in Sydney?
Desktop Speed Test – Week 59 Method
- Compare 8 WordPress Hosts
- Use 8 Live Sites, each with a Different Host but with Identical Content (you can check them out here)
- Use GTmetrix Speed Test
![]()
- Location of Test: Sydney, Australia
- Frequency of Testing: Every Hour for 7 Days
- Number of Weekly Tests = 1 x24 x7 x8 = 1,344 (xHours xDays xSites)
- Desktop Speed Testing is checking how long it takes for a website to fully load using a desktop internet browser
Which WordPress Host will conquer the Desktop Speed Test this week?
WordPress Hosts
Identical Live Sites
Weekly Tests
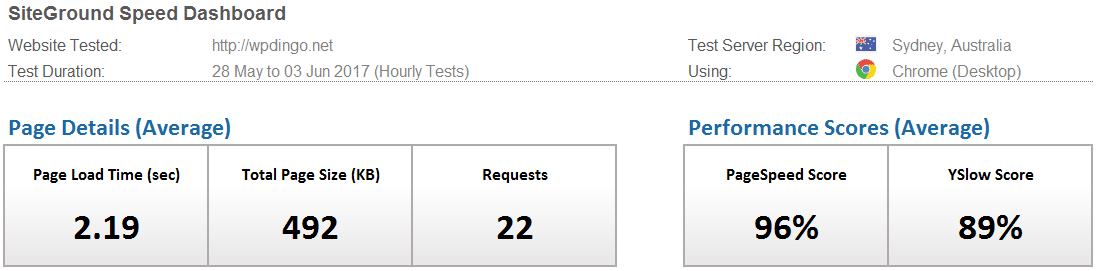
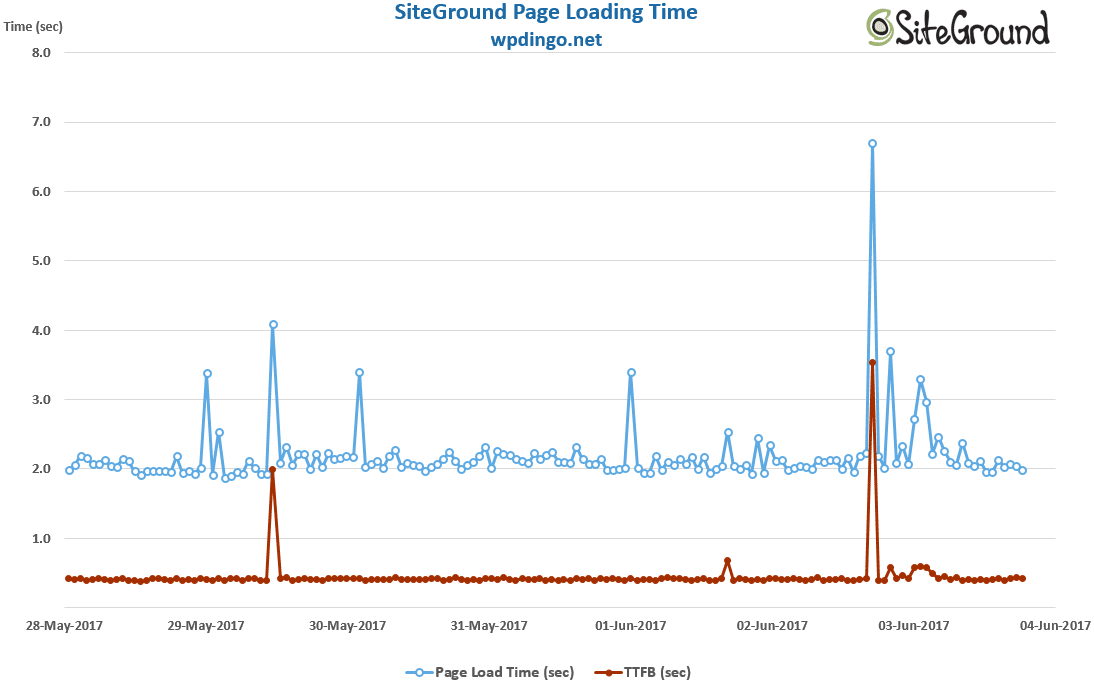
WordPress Host #1: SiteGround
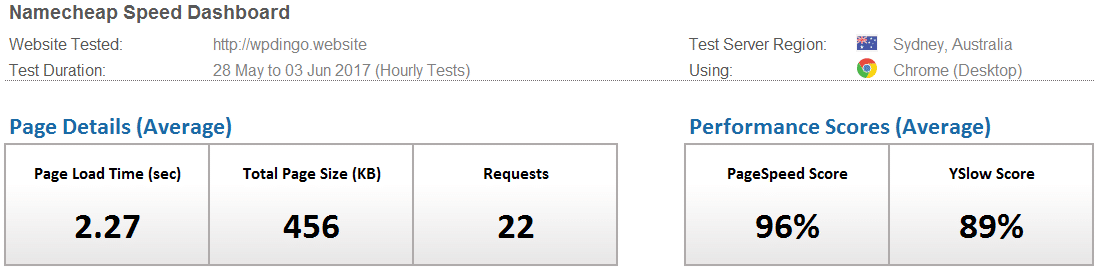
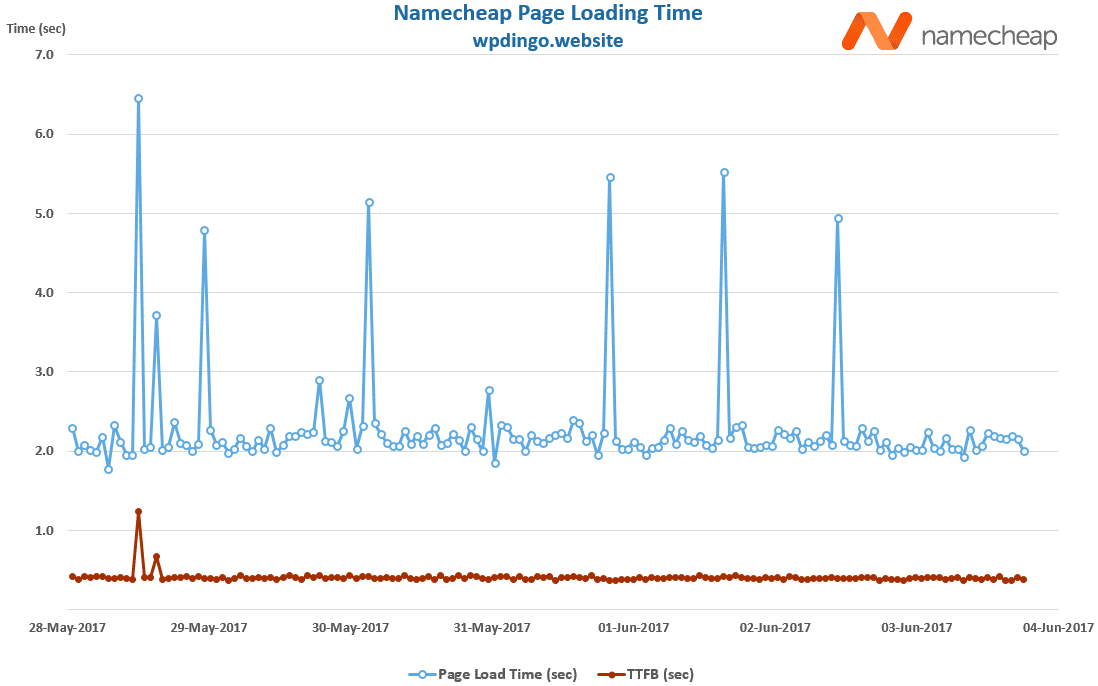
WordPress Host #2: Namecheap
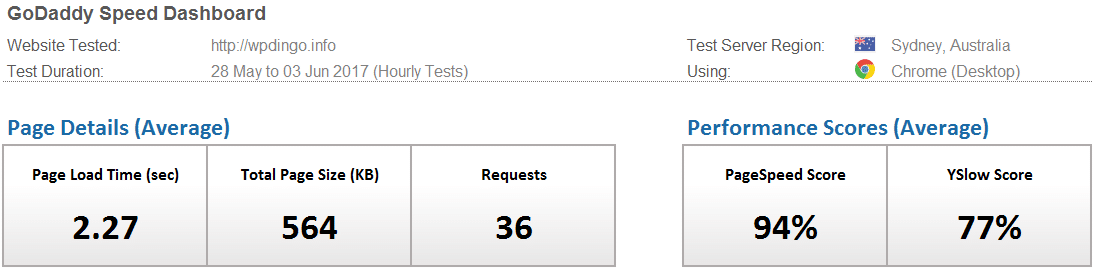
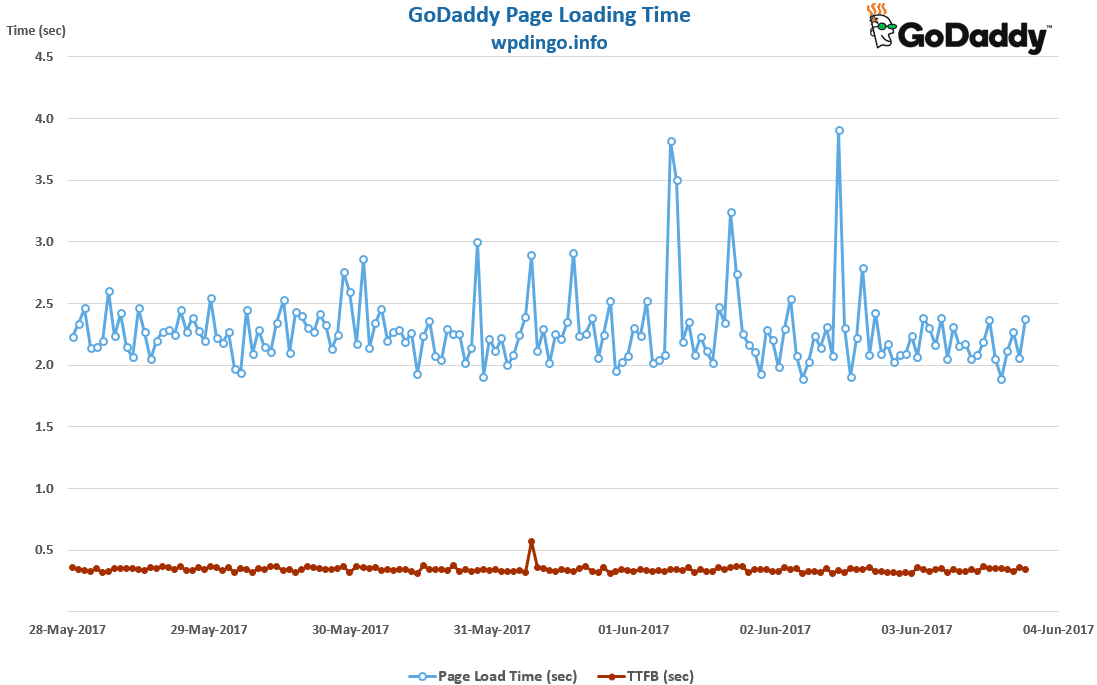
WordPress Host #3: GoDaddy
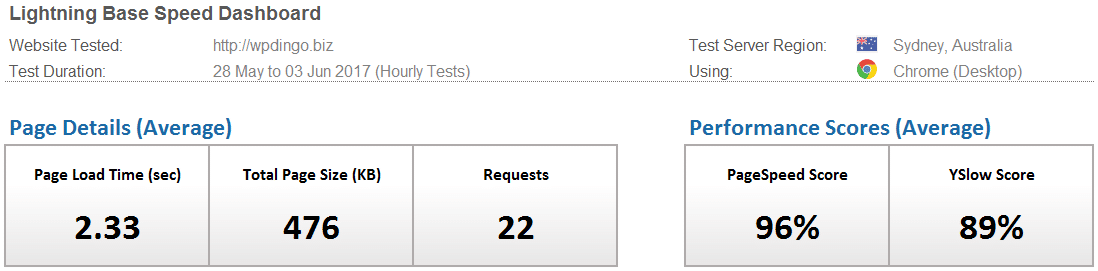
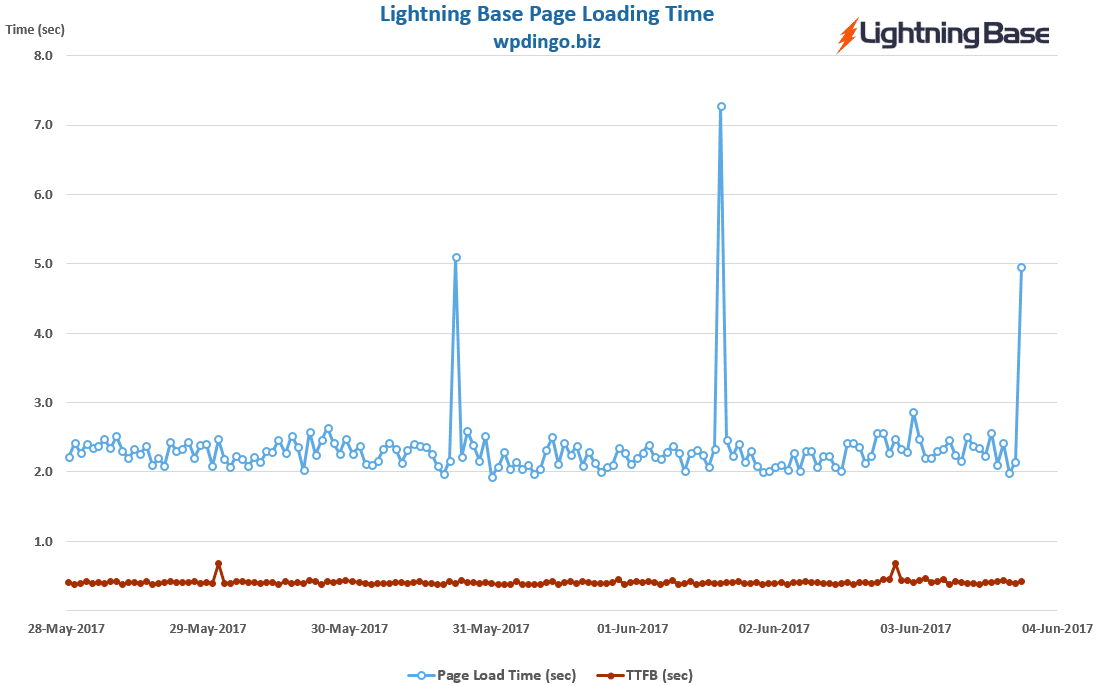
WordPress Host #4: Lightning Base
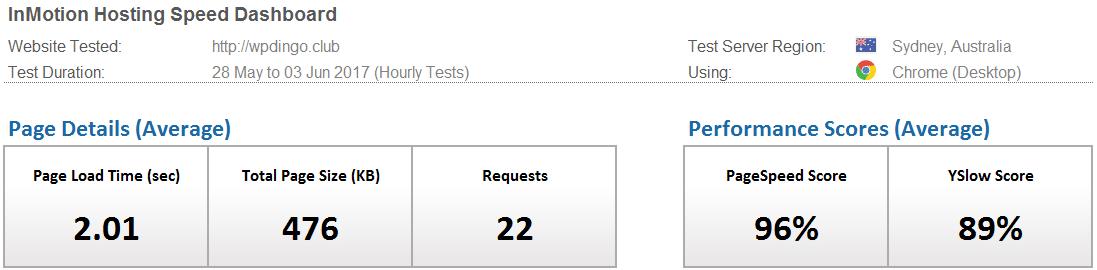
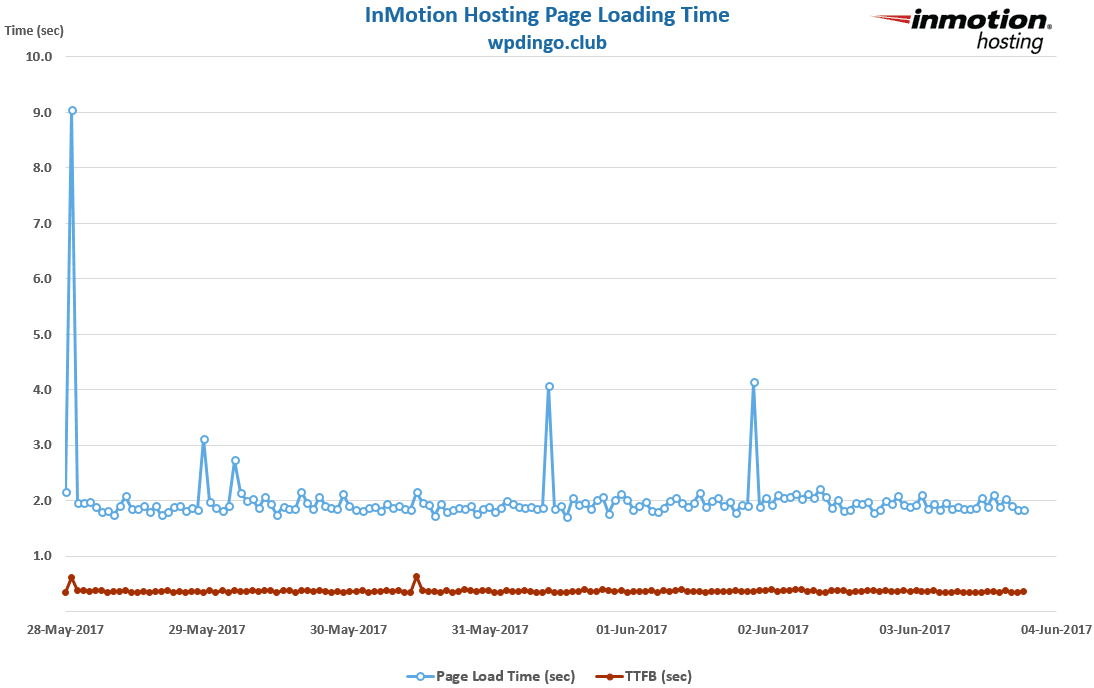
WordPress Host #5: InMotion Hosting
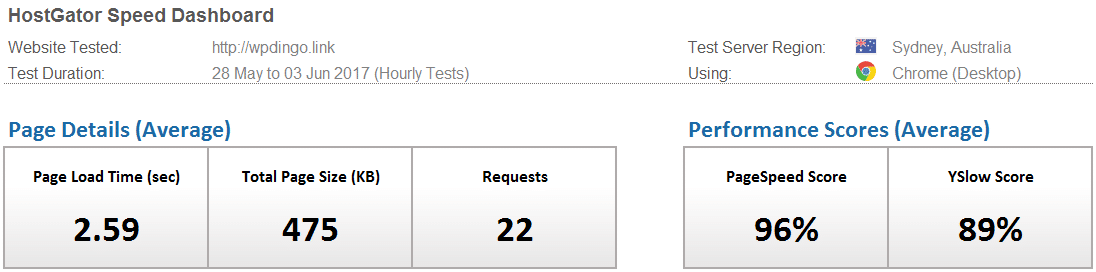
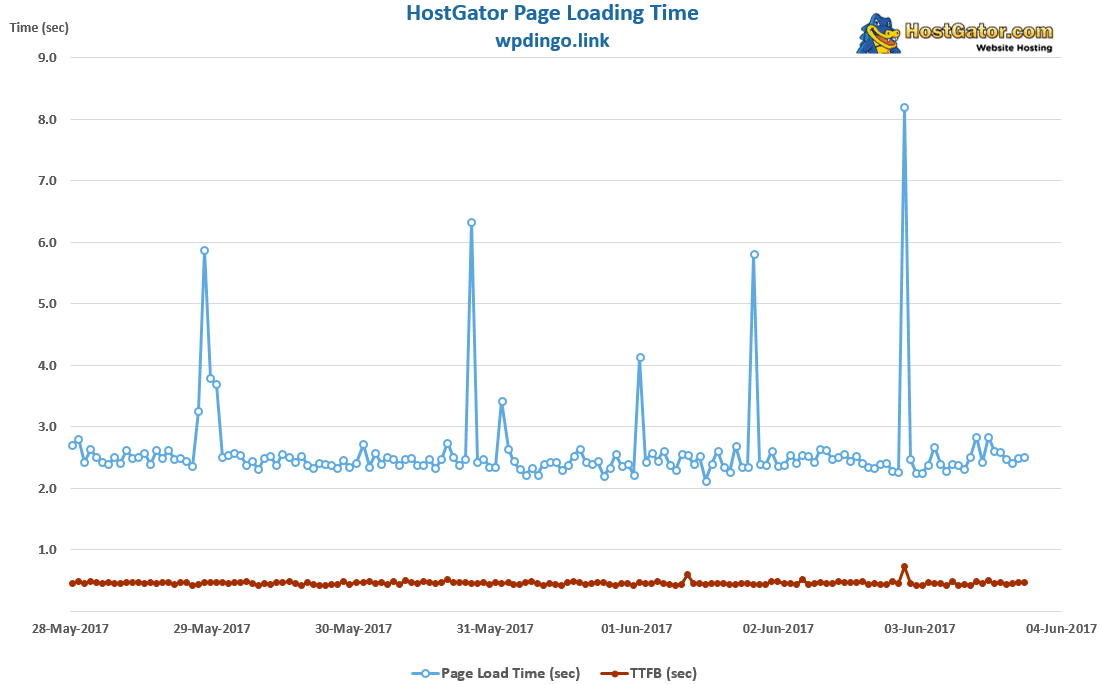
WordPress Host #6: HostGator
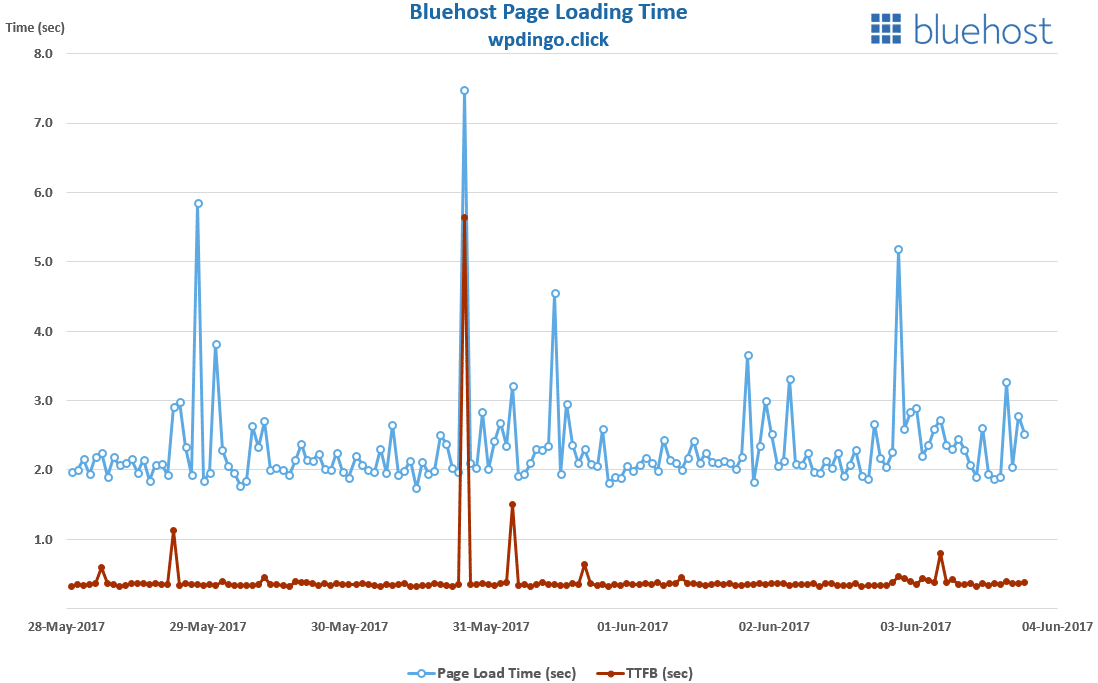
WordPress Host #7: Bluehost
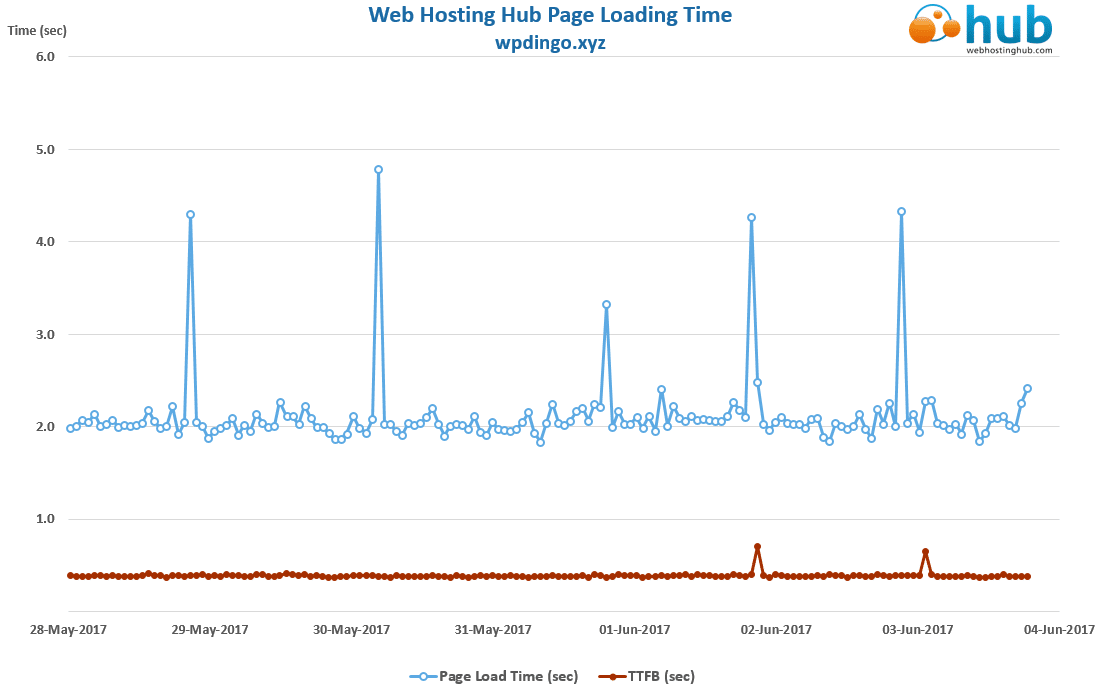
WordPress Host #8: Web Hosting Hub
Desktop Speed Test – Week 59 Summary Table
The winner this week is InMotion Hosting with a time of 2.01s, a fair way behind the Sydney record of 1.03s set by Bluehost in Week 27.
On our last visit to Sydney with WP Super Cache setup (in Week 56), the average load time for our 8 hosts was 3.46s. This week with W3 Total Cache, the average load time is off the charts faster at 2.26s.
This is the third and final week of our W3 Total Cache Speed Study. I will bring together the results so we can see exactly how dominant W3 Total Cache has been.
Next week we’re changing our Caching plugin over to a premium solution, WP Rocket. How will it compare to W3 Total Cache’s impressive results?

And the Week 59 Winner is…
![]()
Desktop Speed Rankings
After 12 months of testing, let’s summarize all the results to see how our 8 hosts are performing overall. It will also allow us to find out which host is currently leading our desktop speed challenge.


 Hi, I'm Clint!


