
Let’s check into the speed of our hosts in North America this week?
Desktop Speed Test – Week 48 Method
- Compare 8 WordPress Hosts
- Use 8 Live Sites, each with a Different Host but with Identical Content (you can check them out here)
- Use GTmetrix Speed Test
![]()
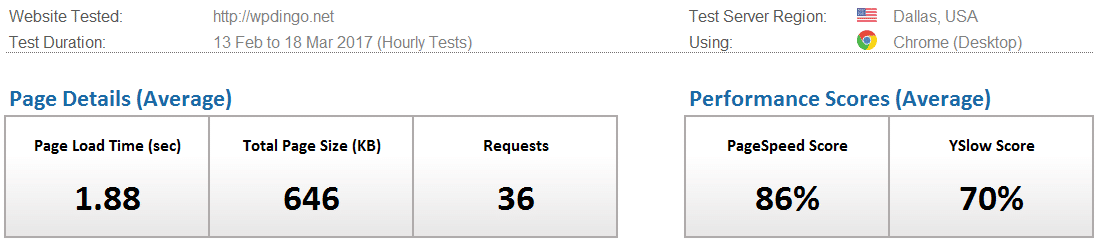
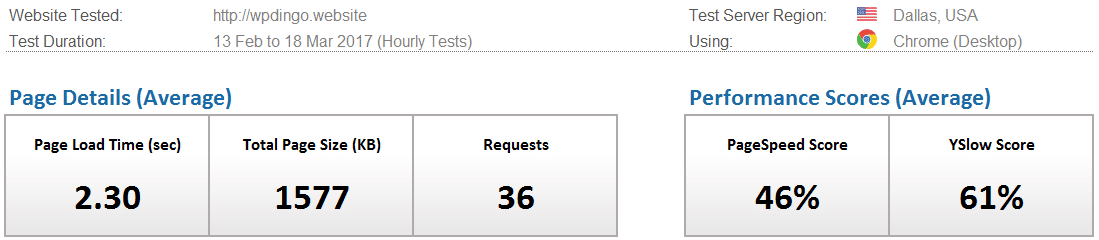
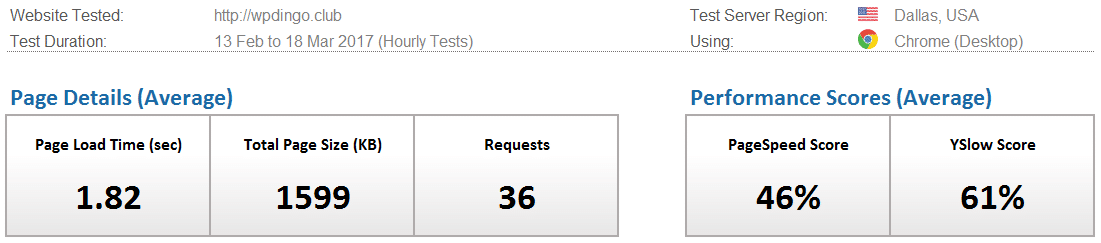
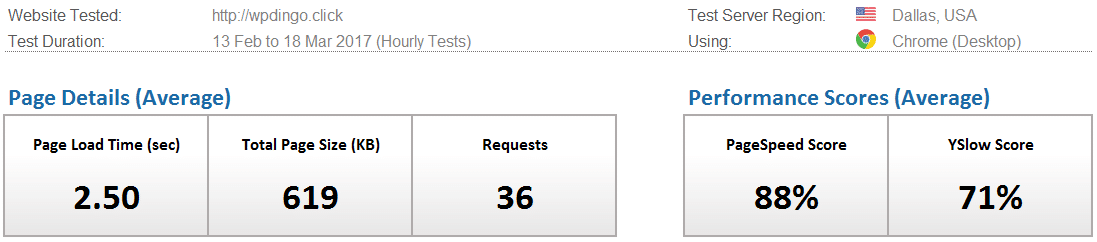
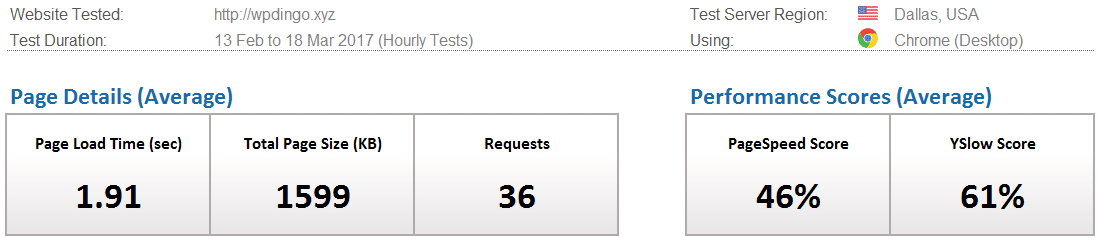
- Location of Test: Dallas, USA
- Frequency of Testing: Every Hour for 7 Days
- Number of Weekly Tests = 1 x24 x7 x8 = 1,344 (xHours xDays xSites)
- Desktop Speed Testing is checking how long it takes for a website to fully load using a desktop internet browser
Which WordPress Host will conquer the Desktop Speed Test this week?
WordPress Hosts
Identical Live Sites
Weekly Tests
WordPress Host #1: SiteGround
WordPress Host #2: Namecheap
WordPress Host #3: GoDaddy
WordPress Host #4: DreamHost
WordPress Host #5: InMotion Hosting
WordPress Host #6: HostGator
WordPress Host #7: Bluehost
WordPress Host #8: Web Hosting Hub
Desktop Speed Test – Week 48 Summary Table
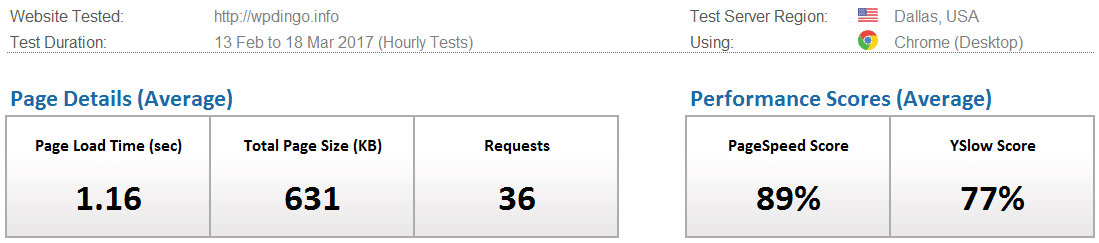
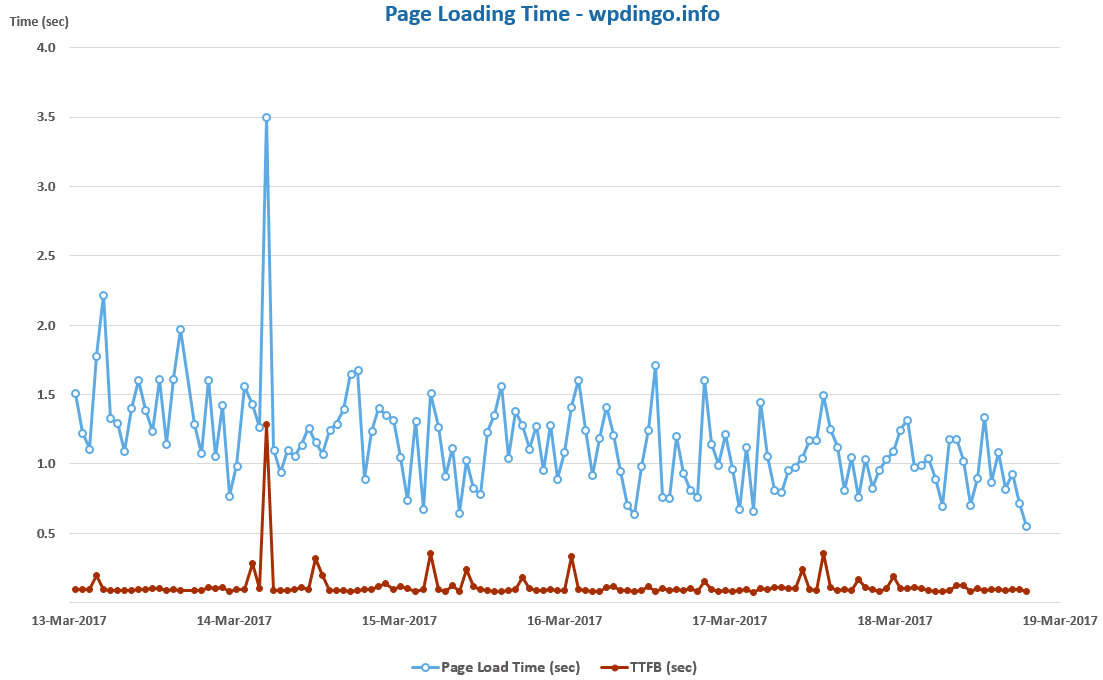
The winner this week is GoDaddy with a time of 1.16s. This time is just behind the Dallas record of 1.02s set by HostGator in Week 21.
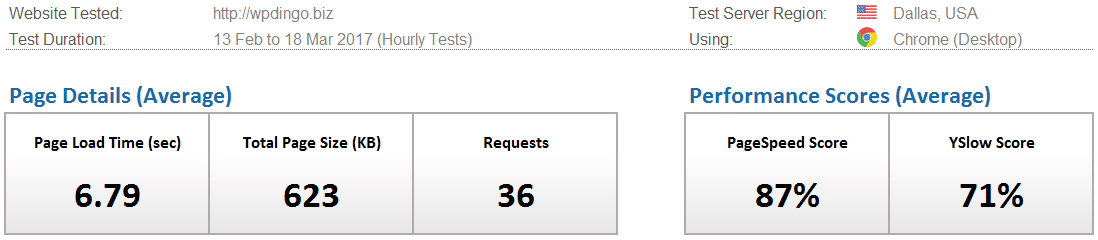
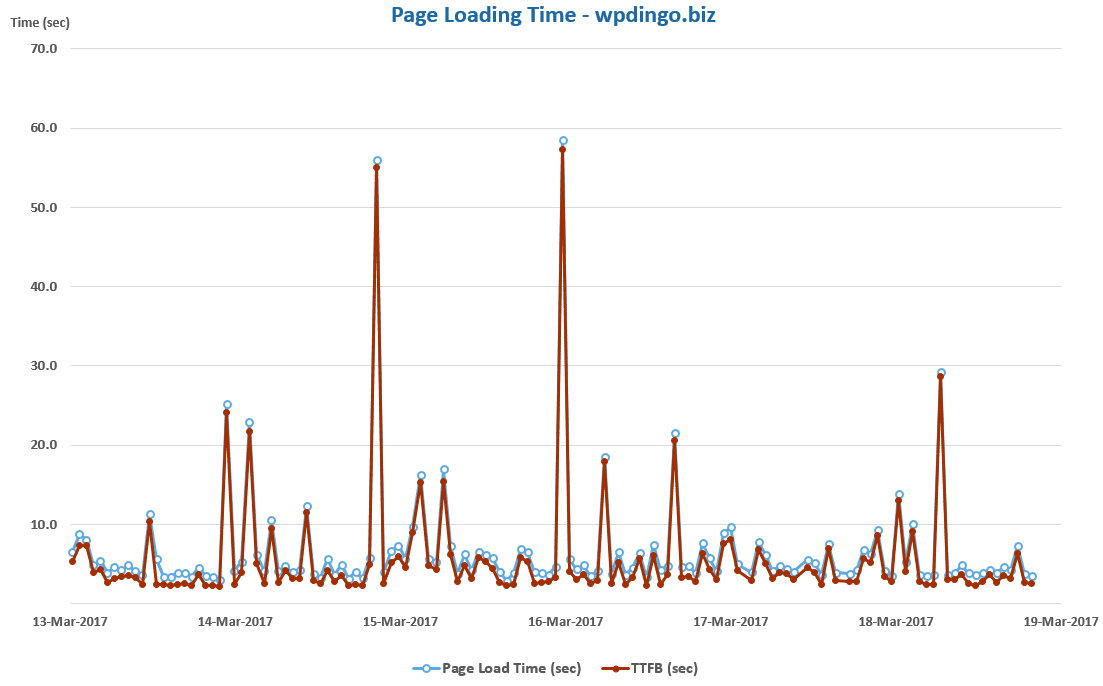
On our last visit to Dallas with EWWW setup (in Week 45), the average page load time for our 8 hosts was 2.26s. This week with EWWW replaced with Kraken, the average load time is slower at 2.60s. Once again, DreamHost has performed extremely poorly, if we remove their results, the average for EWWW is 1.98s, while Kraken is 2.00s.
This is the first week of our Kraken Speed Study and it’s looking as though its going to be a close battle between EWWW and Kraken.
Next week we head to London, as we continue this deep dive into finding the best performing Image Optimizer.

For the 2nd Week in a Row
the Winner is…
![]()
Desktop Speed Rankings
After 9 months of testing, let’s summarize all the results to see how our 8 hosts are performing overall. It will also allow us to find out which host is currently leading our desktop speed challenge.


 Hi, I'm Clint!


