
With WP Rocket combined with KeyCDN & Cloudflare, which host is ripping it up this week in Sydney?
Desktop Speed Test – Week 80 Method
- Compare 8 WordPress Hosts
- Use 8 Live Sites, each with a Different Host but with Identical Content (you can check them out here)
- Use GTmetrix Speed Test
![]()
- Location of Test: Sydney, Australia
- Frequency of Testing: Every Hour for 7 Days
- Number of Weekly Tests = 1 x24 x7 x8 = 1,344 (xHours xDays xSites)
- Desktop Speed Testing is checking how long it takes for a website to fully load using a desktop internet browser
Which WordPress Host will conquer the Desktop Speed Test this week?
WordPress Hosts
Identical Live Sites
Weekly Tests
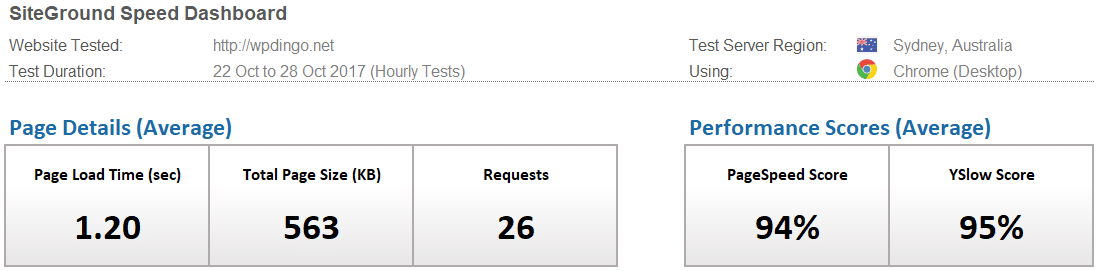
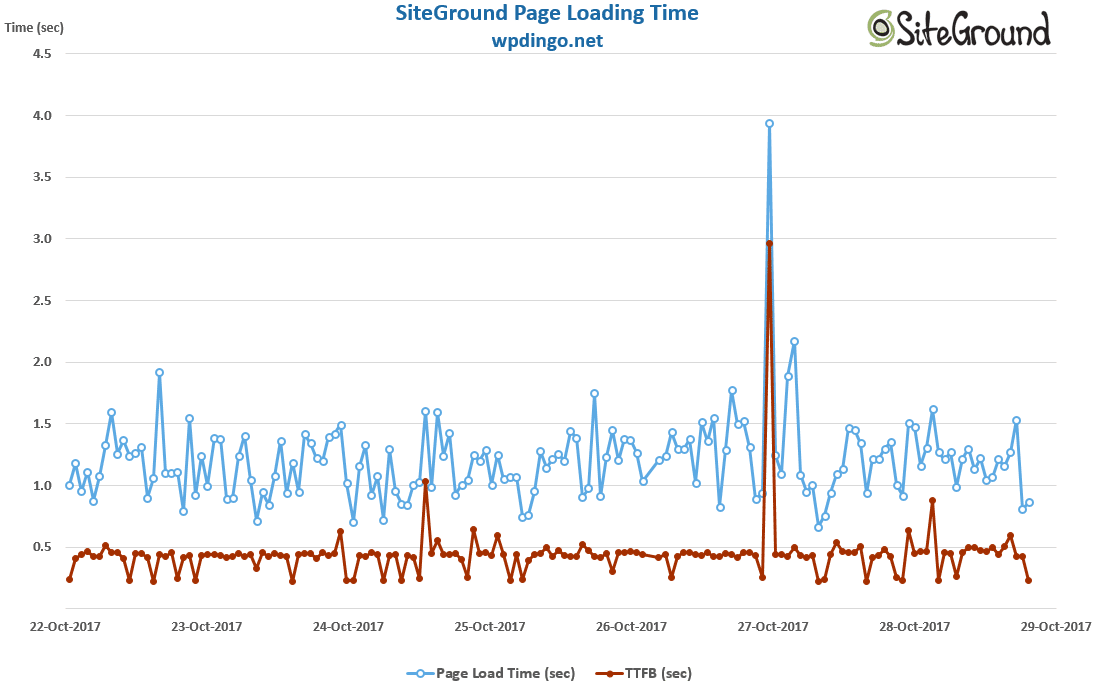
WordPress Host #1: SiteGround
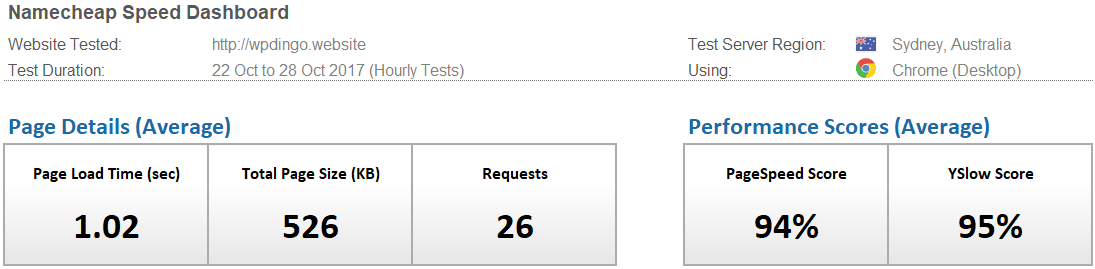
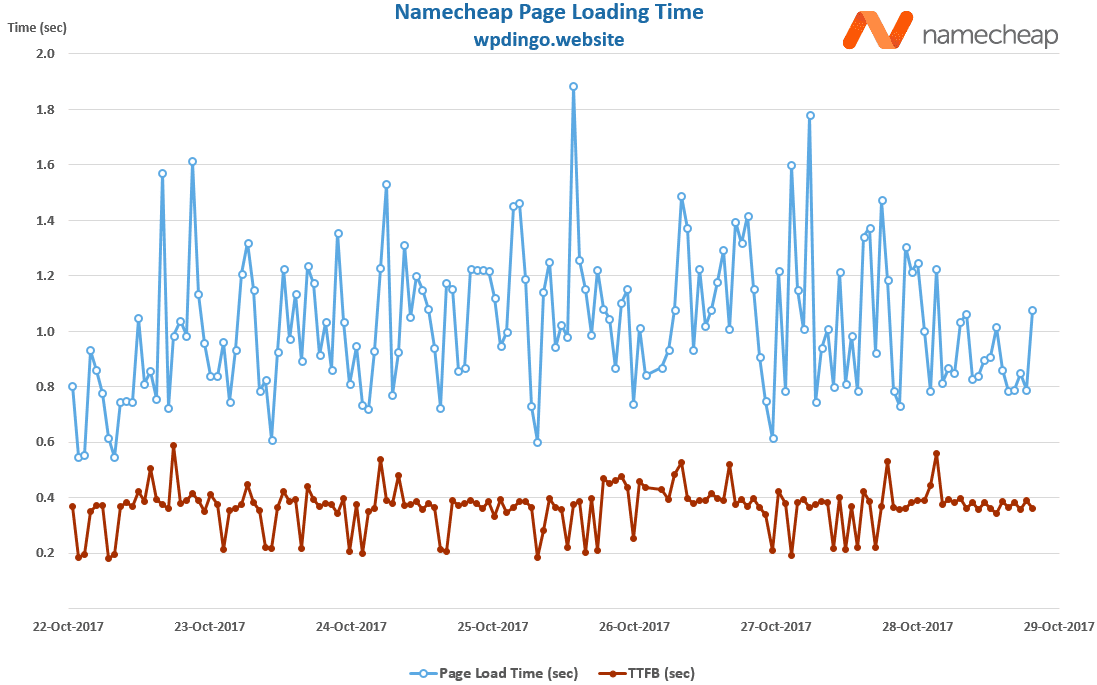
WordPress Host #2: Namecheap
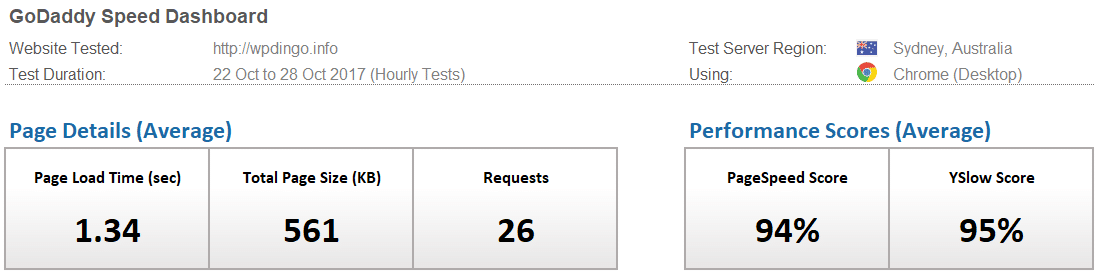
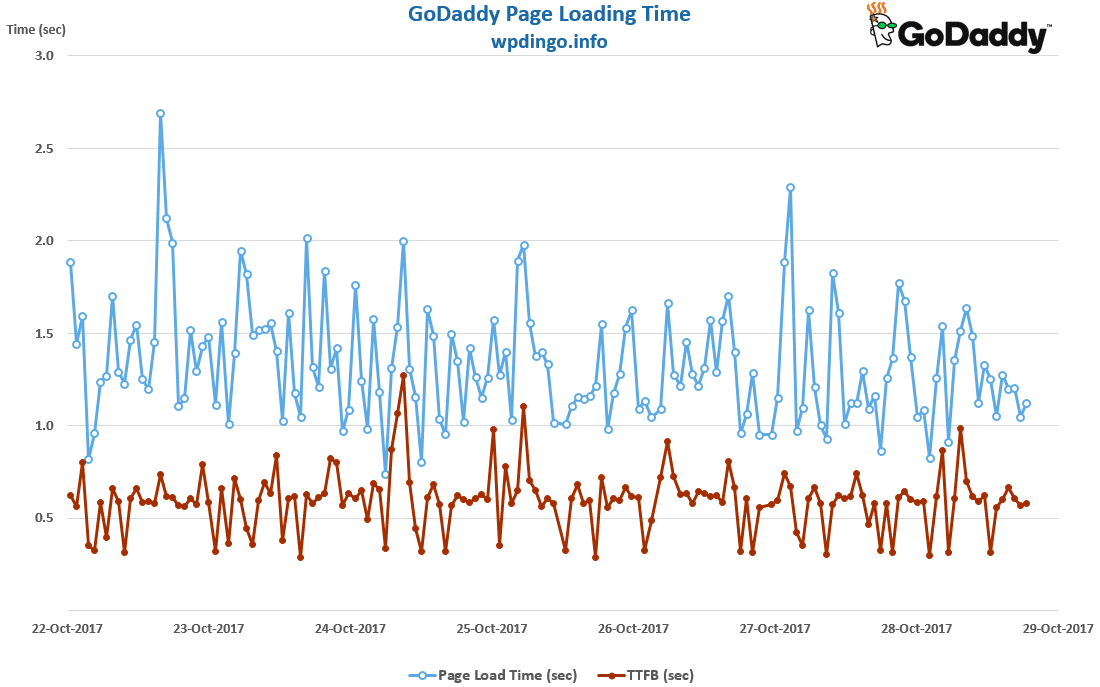
WordPress Host #3: GoDaddy
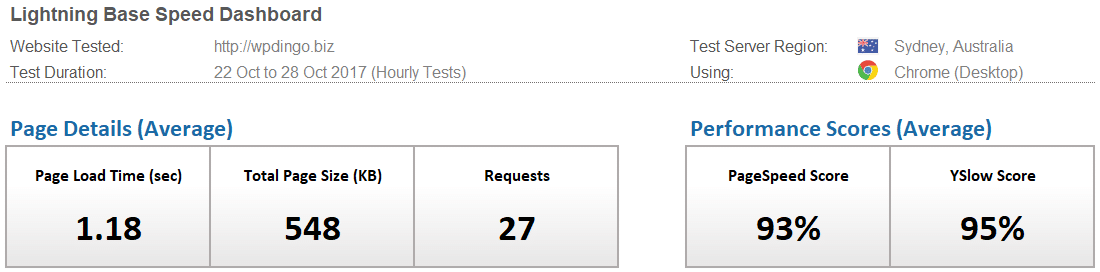
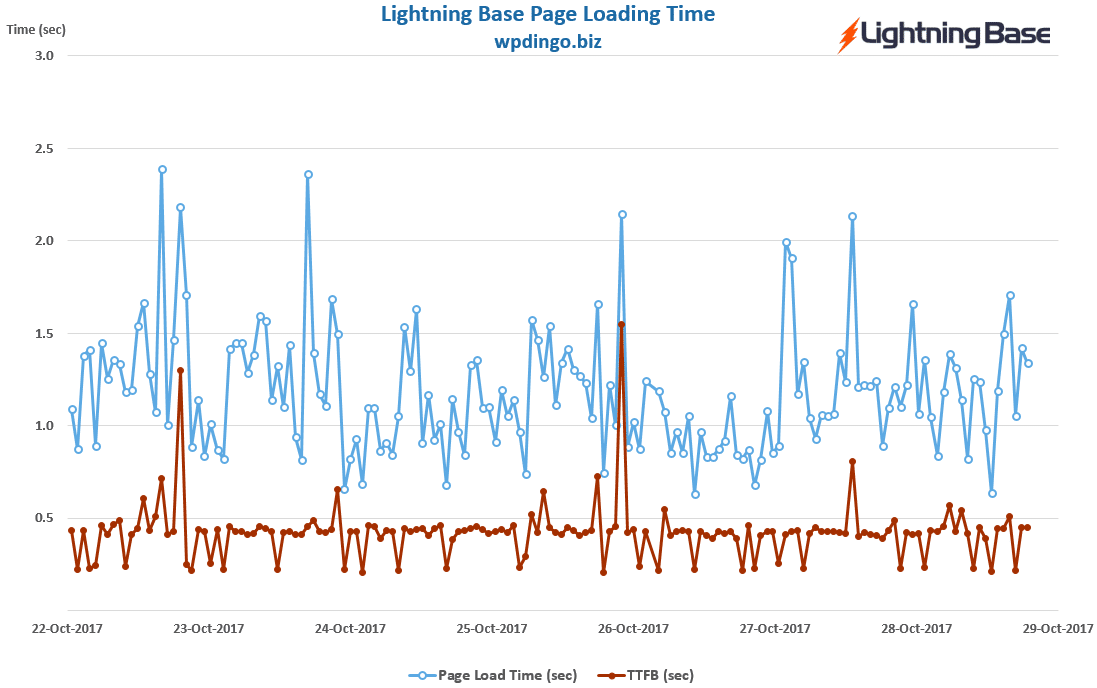
WordPress Host #4: Lightning Base
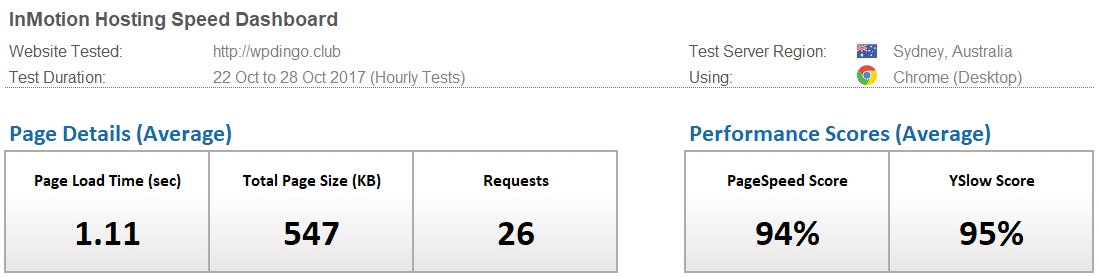
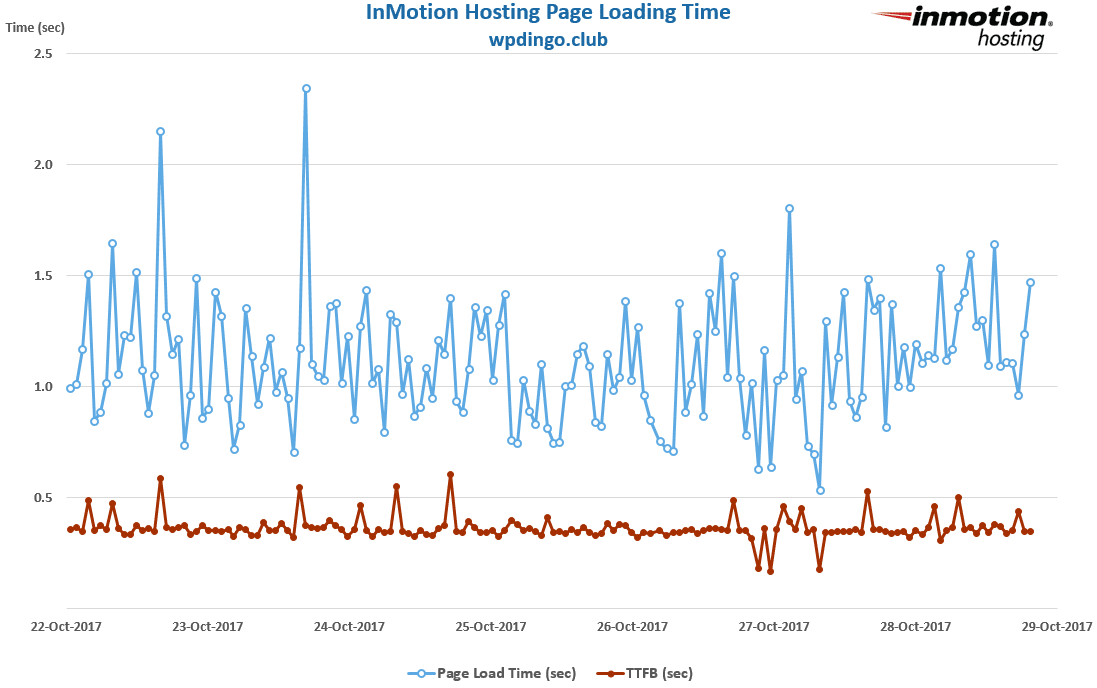
WordPress Host #5: InMotion Hosting
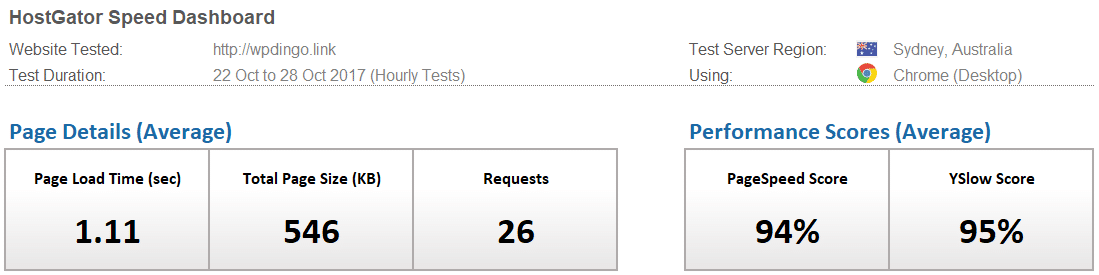
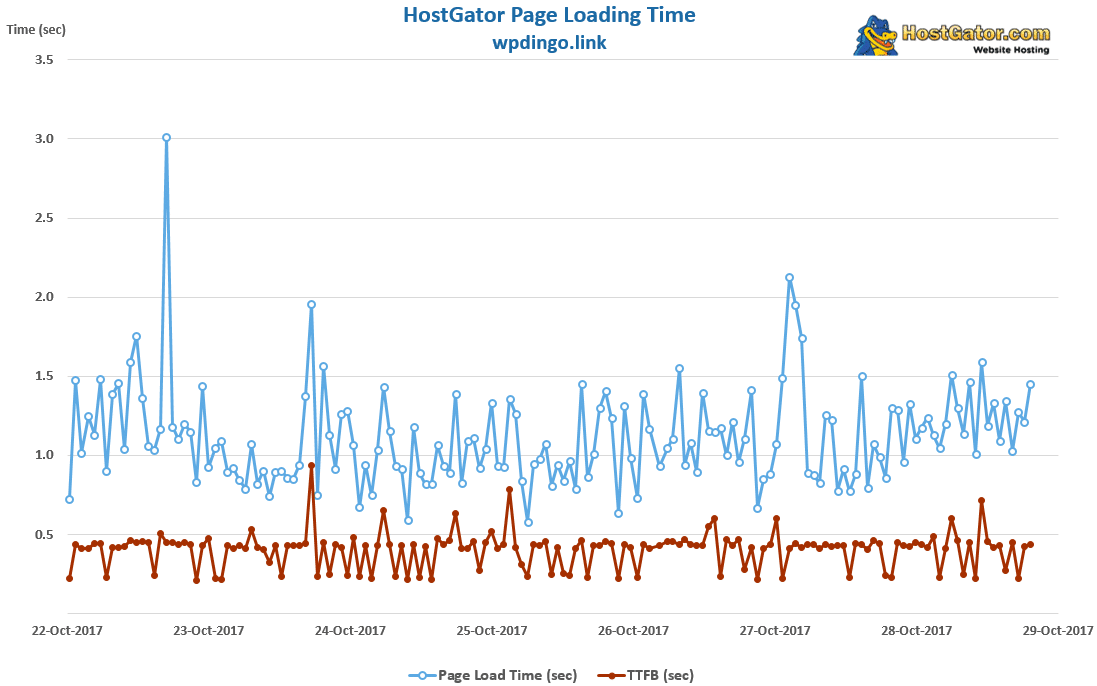
WordPress Host #6: HostGator
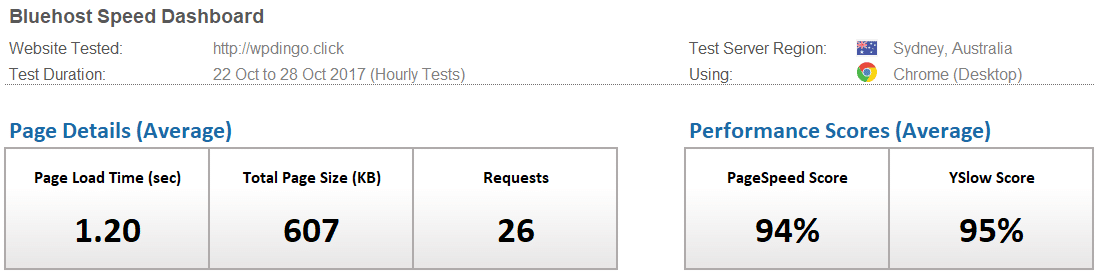
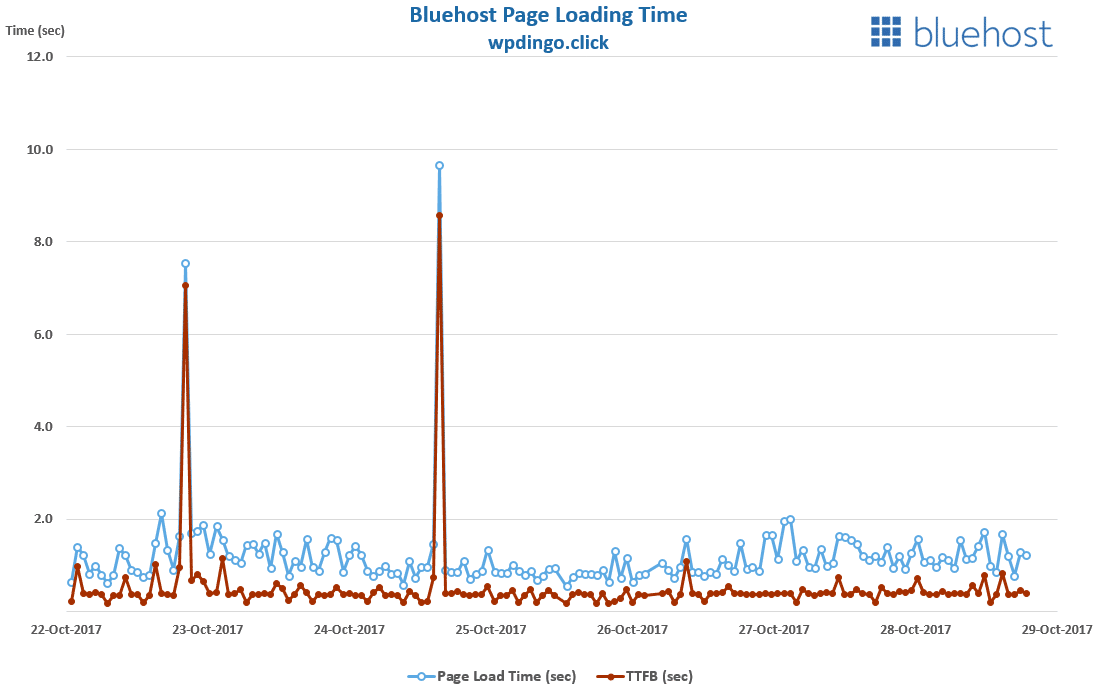
WordPress Host #7: Bluehost
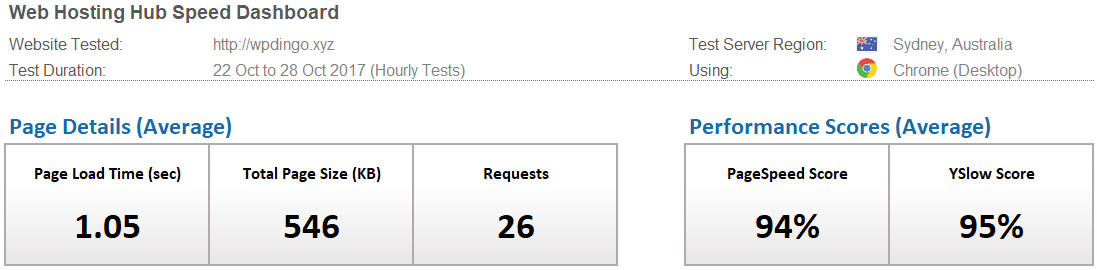
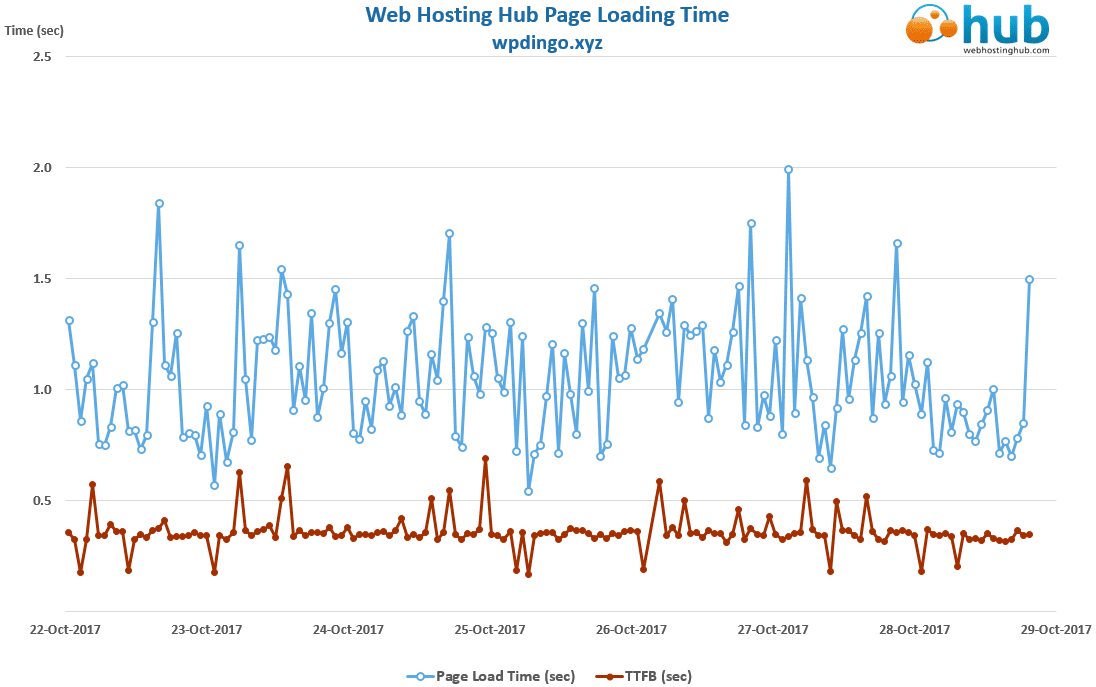
WordPress Host #8: Web Hosting Hub
Desktop Speed Test – Week 80 Summary Table
The winner this week is Namecheap with a time of 1.02s, which equals the all time Sydney record, which was also set by Namecheap in Week 71.
On our last visit to Sydney with KeyCDN, Cloudflare & WP Super Cache setup (in Week 77), the average load time for our 8 hosts was 1.44s. This week with WP Rocket replacing WP Super Cache, the average load time is faster at 1.15s.
This is the third and final week of our KeyCDN, Cloudflare & WP Rocket Speed Study, and WP Rocket looks to have outperformed WP Super Cache.
Next week we’ll be switching up the CDN solution. I wonder whether we’ll we see a big difference in our page loading speed?

And this Week’s Winner is…
![]()
Desktop Speed Rankings
After 18 months of testing, let’s summarize all the results to see how our 8 hosts are performing overall. It will also allow us to find out which host is currently leading our desktop speed challenge.


 Hi, I'm Clint!


