Our new premium hosts are all good to go, who will blow the competition away this week in Mumbai?
Speed Test – Week 143 Method
- Compare 6 WordPress Hosts
- Use 6 Live Sites, each with a Different Host but with Identical Content (you can check them out here)
- Use GTmetrix Speed Test

- Location of Test: Mumbai, India
- Plugins Installed: None
- Frequency of Testing: Every Hour for 7 Days
- Number of Weekly Tests = 1 x24 x7 x6 = 1,008 (xHours xDays xSites)
- Speed Testing is checking how long it takes for a website to fully load using a desktop internet browser
Which WordPress Host will conquer the Speed Test this week?
WordPress Hosts
Identical Live Sites
Weekly Tests
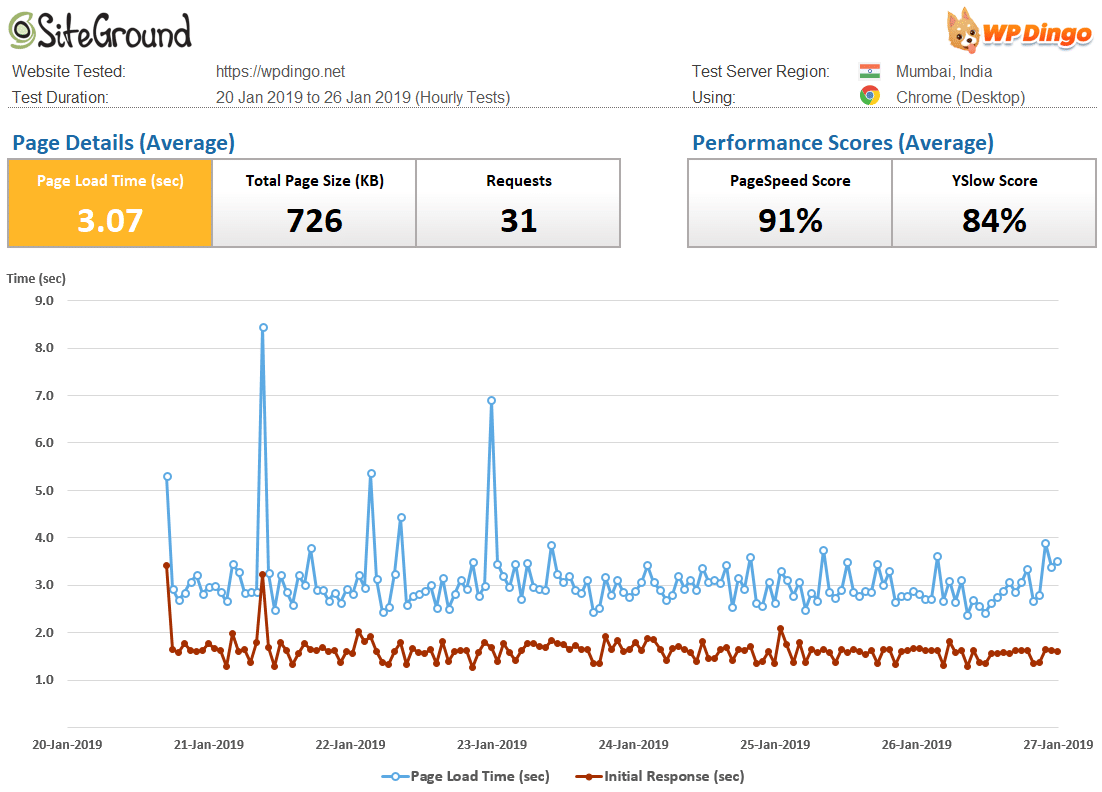
SiteGround Weekly Speed Results
Lightning Base Weekly Speed Results
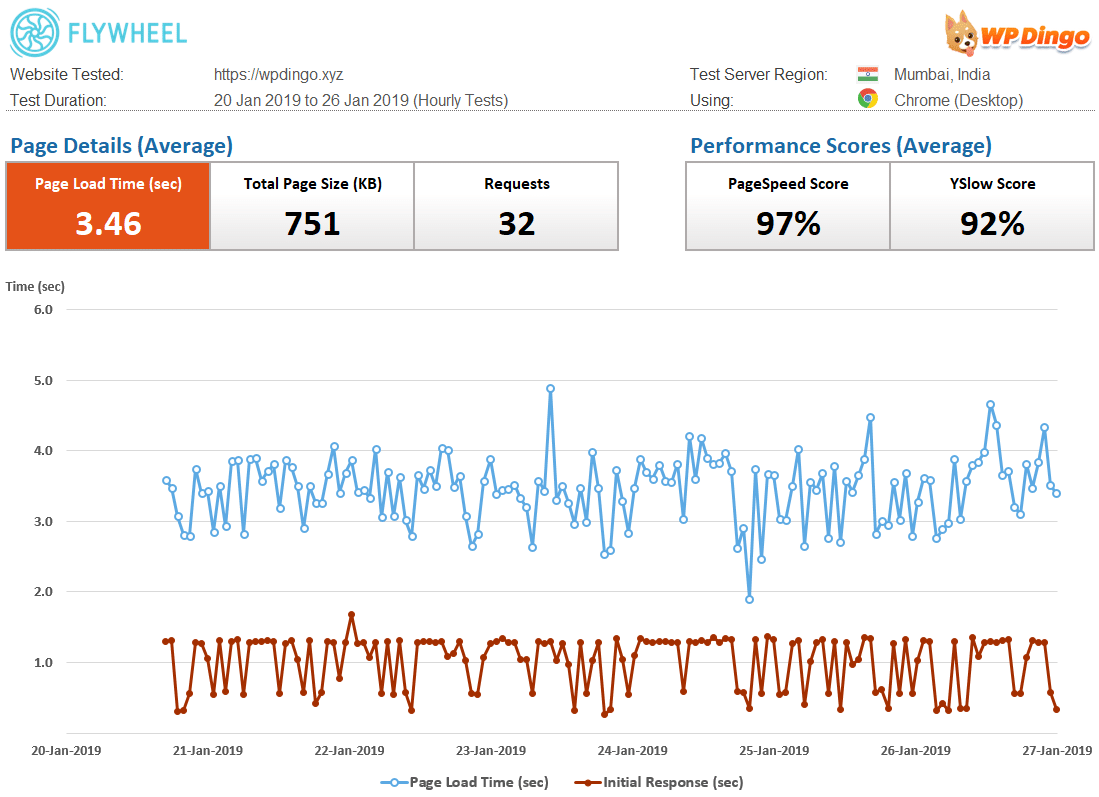
flywheel Weekly Speed Results
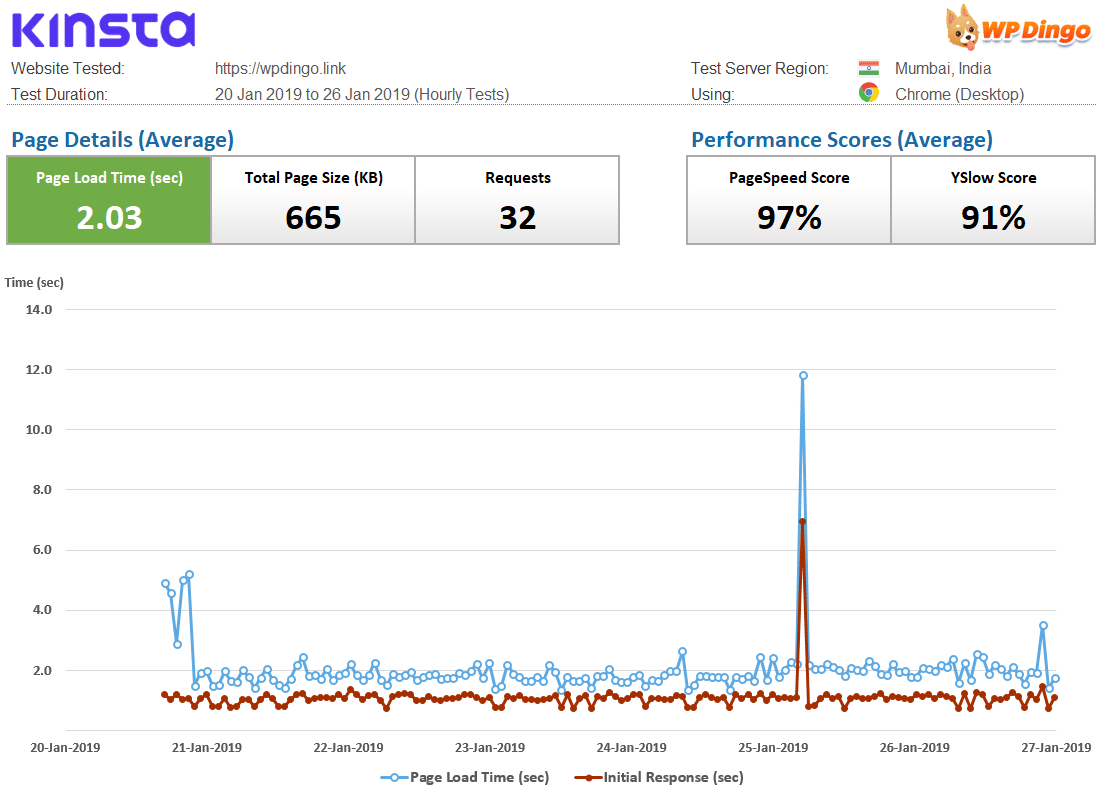
kinsta Weekly Speed Results
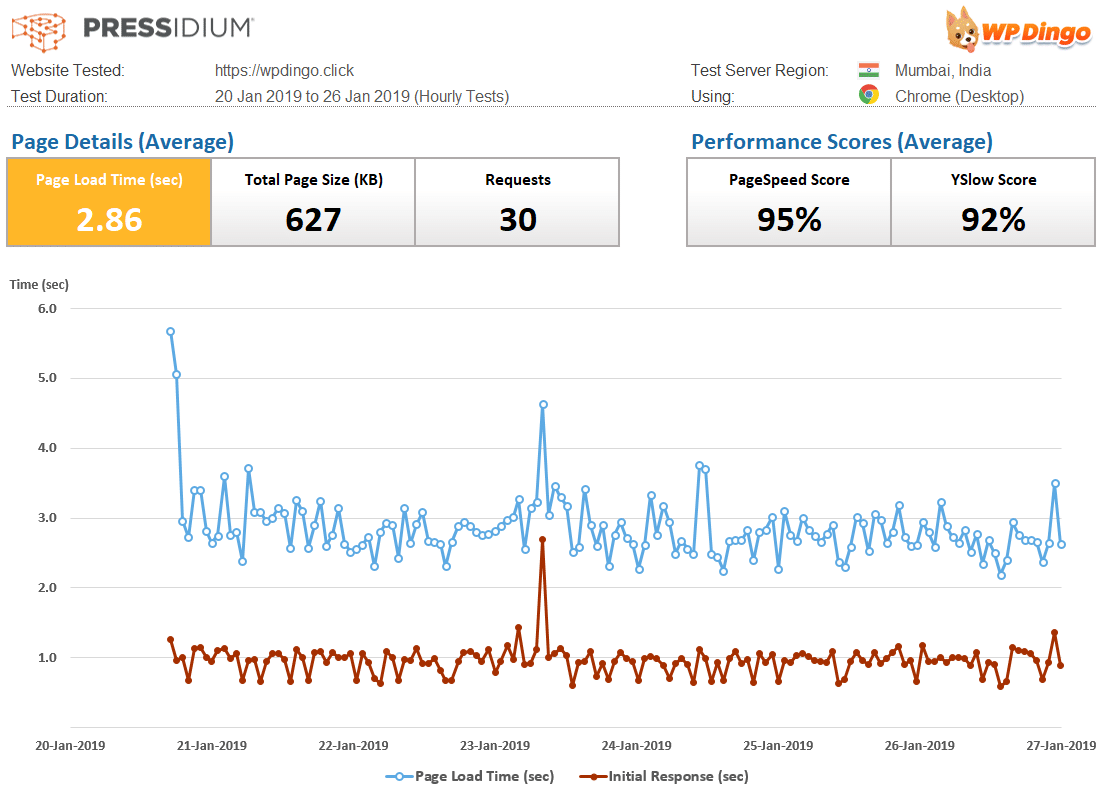
pressidium Weekly Speed Results
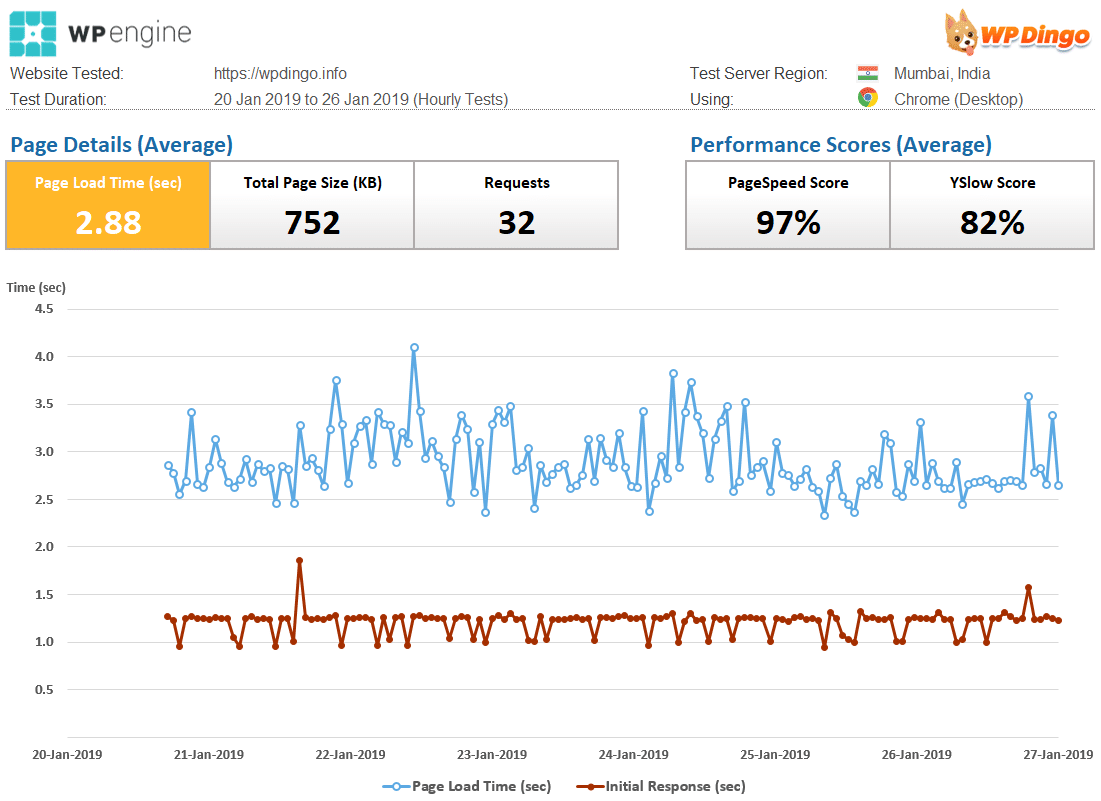
wp engine Weekly Speed Results
Speed Test – Week 143 Summary Table
For the 3rd week in a row, the fastest host is Kinsta with a time of 2.03s.
It’s early days with our 4 new premium hosts, but it is interesting to see Kinsta pull away from the pack in Mumbai. The other fascinating observation is that Flywheel is our first premium host to be outpointed by our best budget hosts of Lightning Base & SiteGround.
For next week’s test, I will change up our testing location to Vancouver. I wonder whether Kinsta will continue to dominate in Canadian waters?
And this Week’s Winner is…

Speed Rankings
With our new hosts yet to achieve enough results to summarise, feel free to check out how our previous hosts performed over the course of 3 years of testing.





 Hi, I'm Clint!


