
Which of our hosts are dominating the skies this week from Asia Pacific?
Uptime Test – Week 35 Method
- Compare 8 WordPress Hosts
- Use 8 Live Sites, each with a Different Host but with Identical Content (you can check them out here)
- Use Pingdom Uptime Test
![]()
- Location of Test: 10 Asia Pacific Locations
- Frequency of Testing: Every Minute across the Last 7 Days
- Number of Weekly Tests = 1 x60 x24 x7 x8 = 80,640 (xMinutes xHours xDays xSites)
- Uptime testing is confirming that the website is actually accessible to visitors
- An example of why an outage (or downtime) can occur is scheduled maintenance of the server the website is hosted on
Which WordPress Hosts can ace the uptime test this week?
WordPress Hosts
Identical Live Sites
Weekly Tests
WordPress Host #1: SiteGround
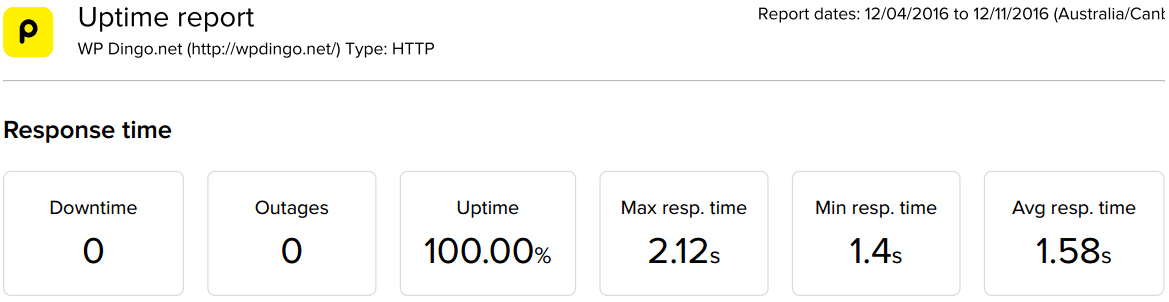
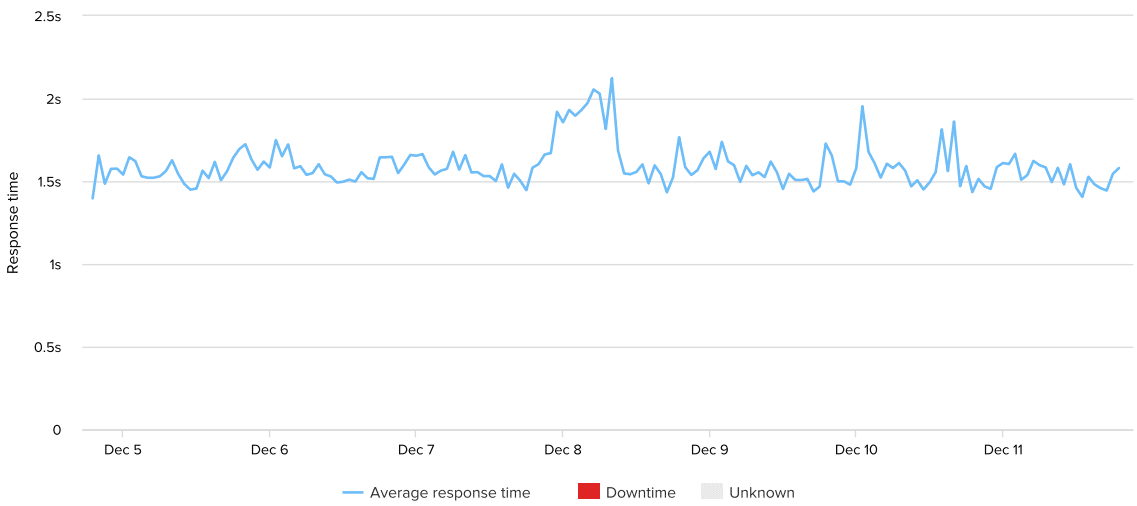

WordPress Host #2: A2 Hosting
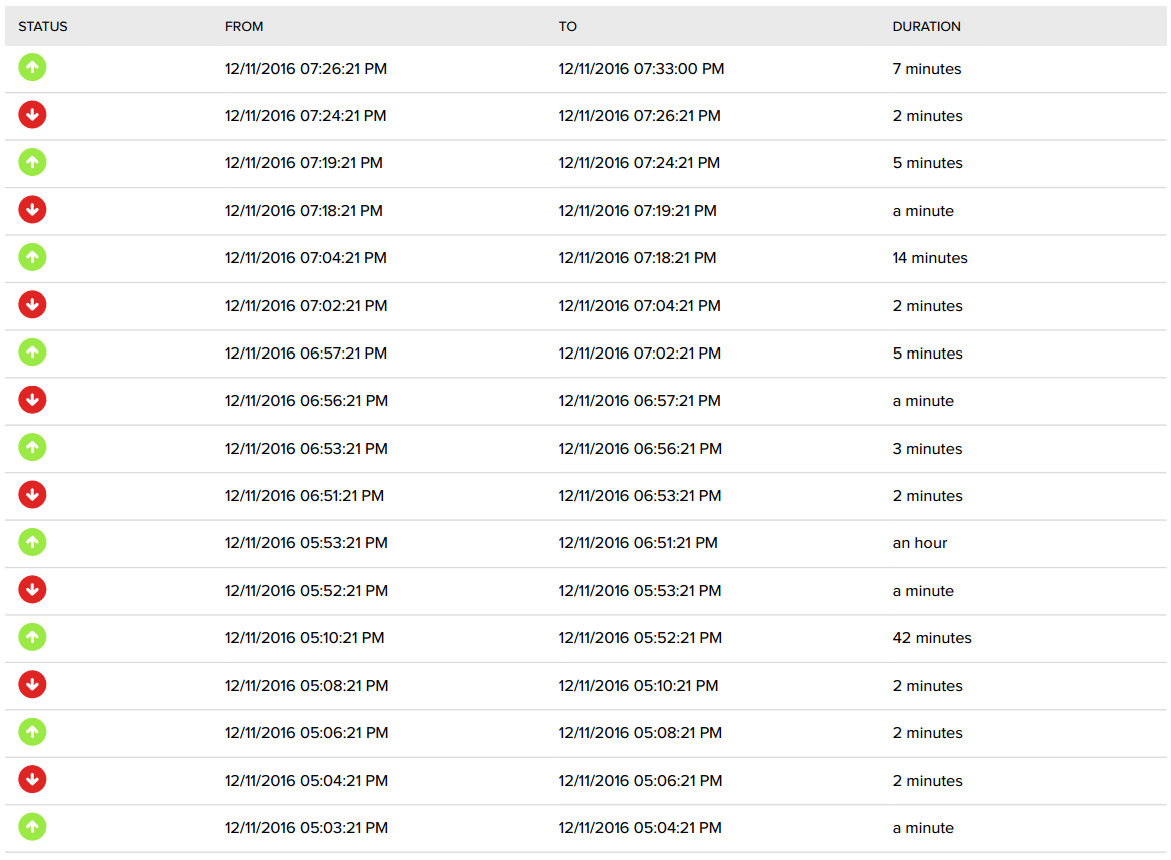
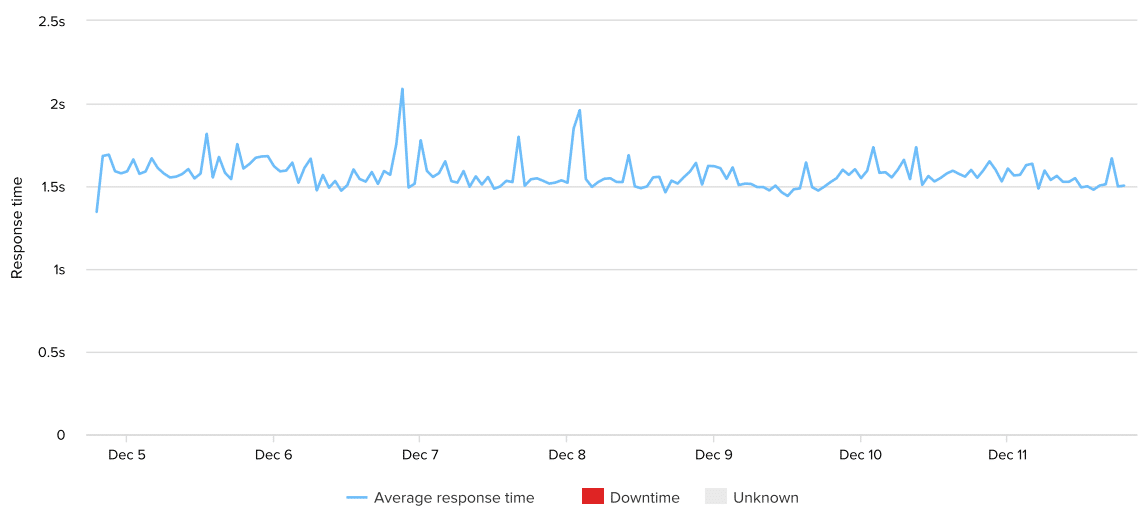
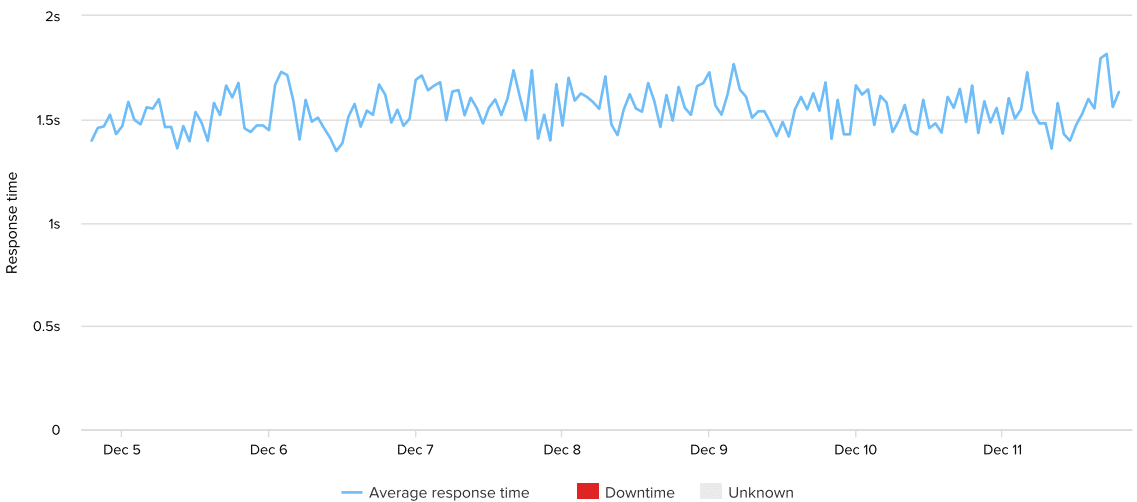
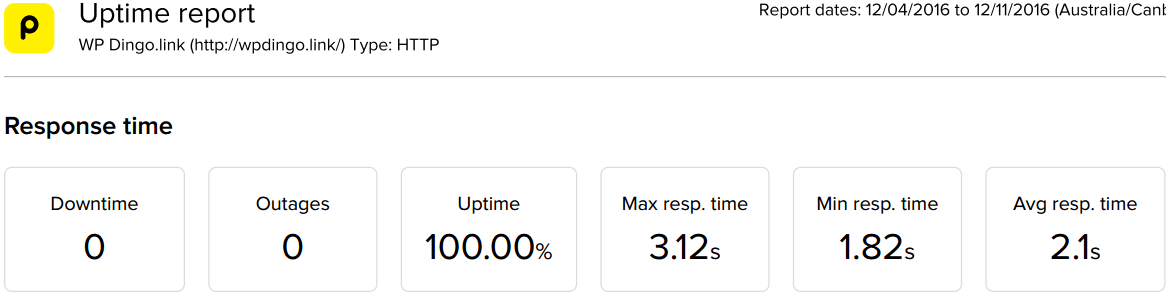
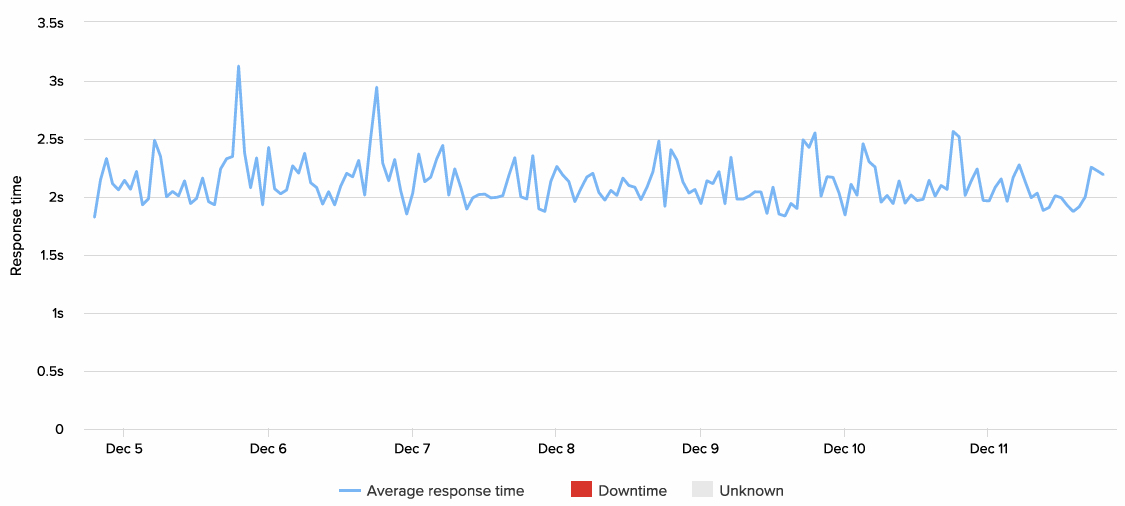
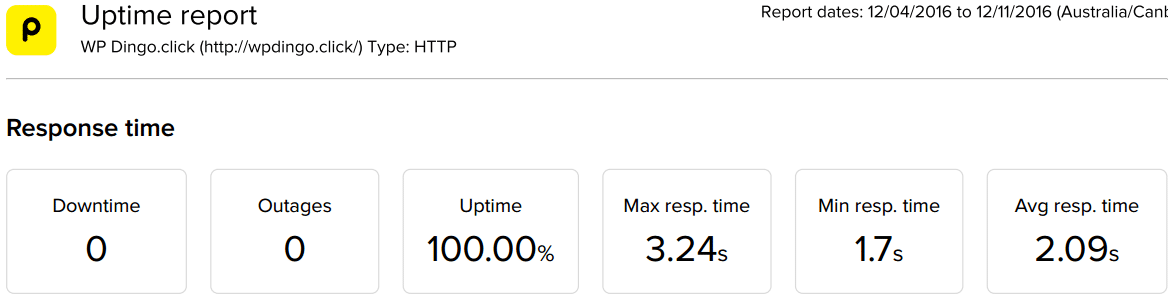
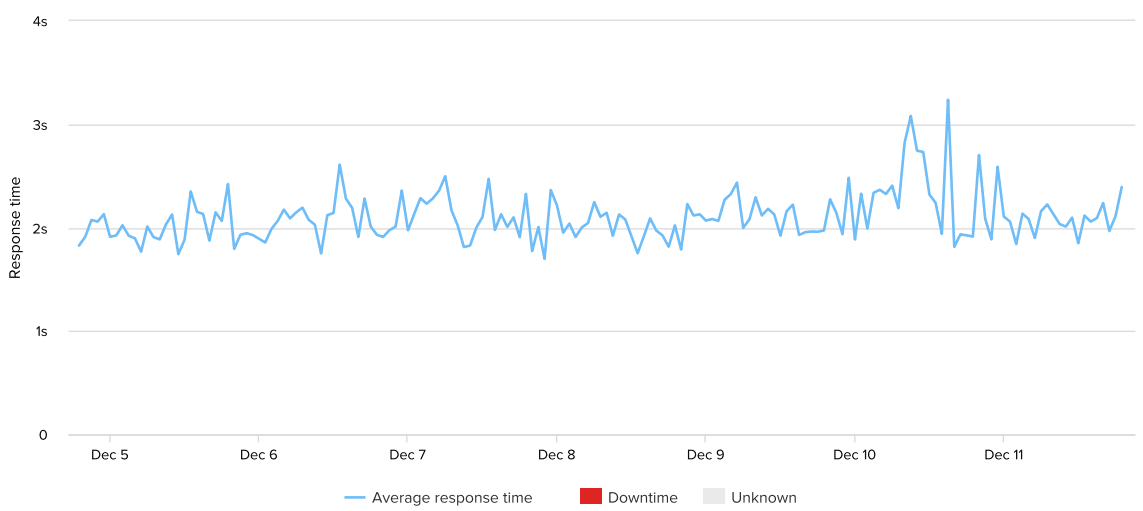
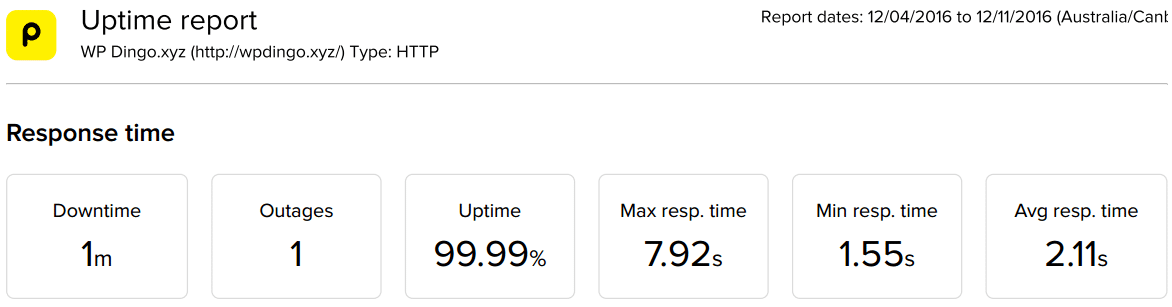
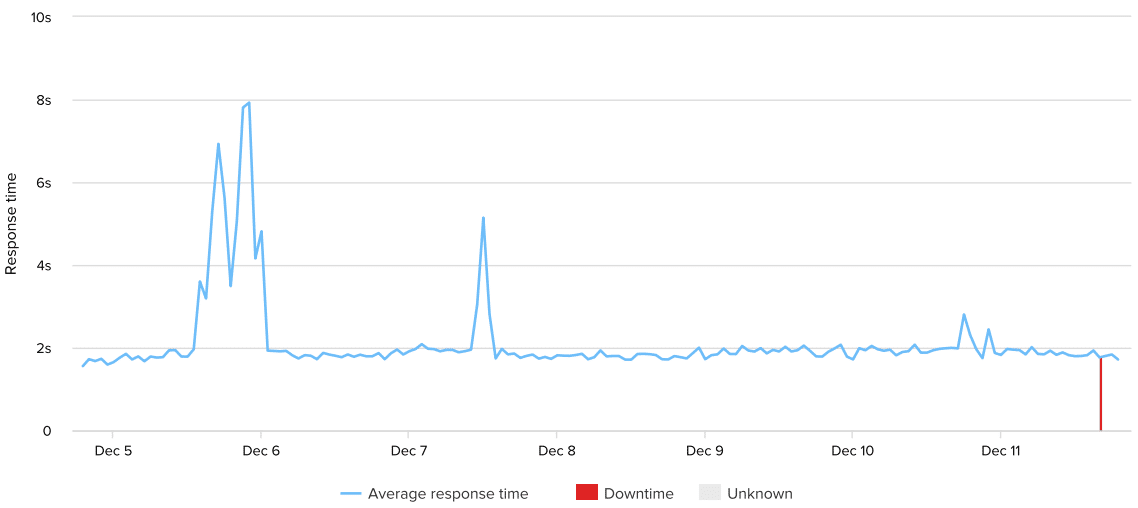
A sample of the Uptime Status (Over 8 pages in total):
WordPress Host #3: GoDaddy

WordPress Host #4: DreamHost

WordPress Host #5: InMotion Hosting


WordPress Host #6: HostGator

WordPress Host #7: Bluehost

WordPress Host #8: Web Hosting Hub

Uptime Test – Week 35 Summary Table
Our hosts have recorded a very impressive uptime performance this week, with 6 hosts achieving the ultimate goal of 100% Uptime (an amazing recovery from last week where only 1 host achieved 100%):
- GoDaddy
- InMotion Hosting
- DreamHost
- SiteGround
- Bluehost
- HostGator
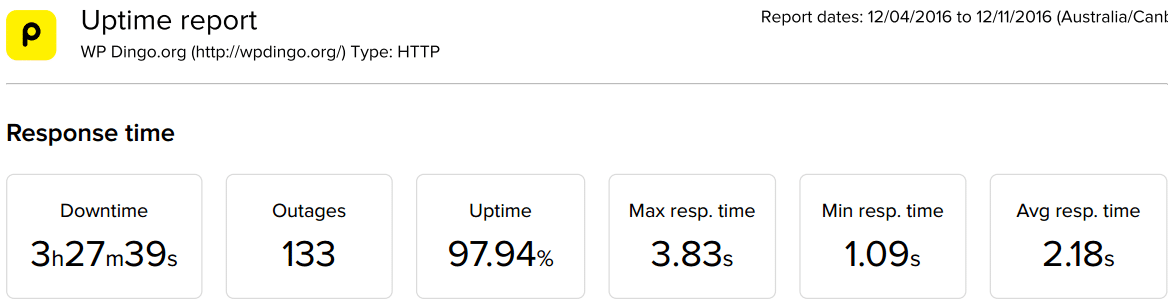
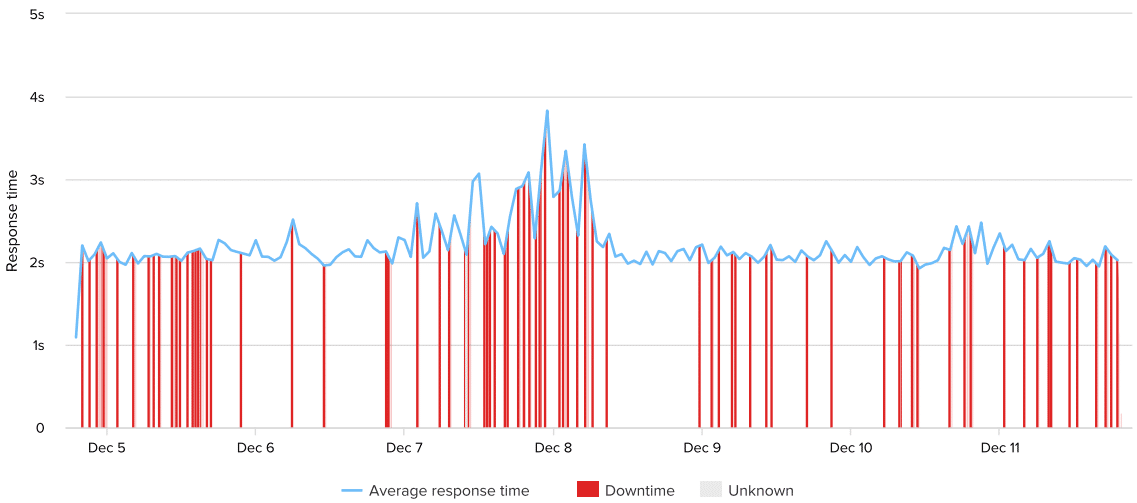
Unfortunately, this week A2 Hosting had the worst ever recorded uptime result, with almost 3.5 hours of downtime from 133 separate outages. This is a terrible performance, and hopefully whatever is causing this will be rectified shortly.
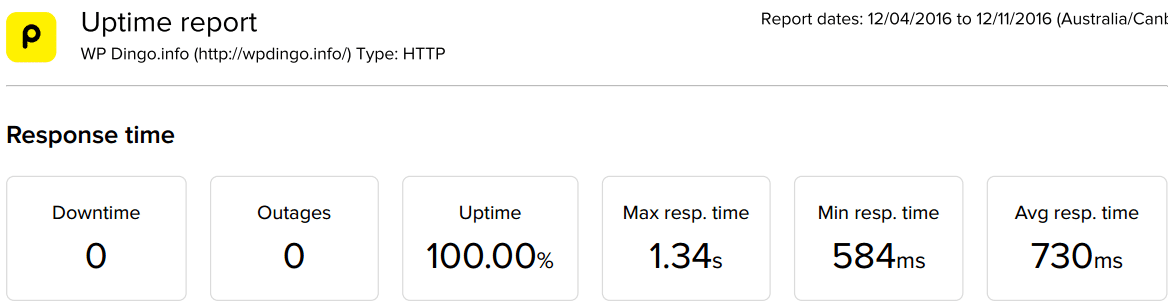
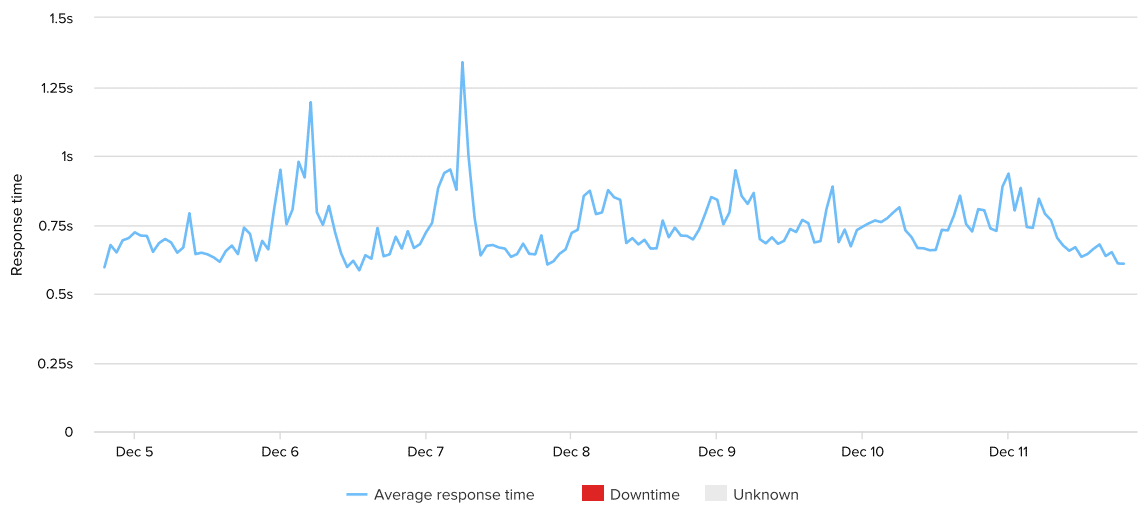
And our winner this week is GoDaddy, recording the fastest time of 730ms. The last time we ran this Asia Pacific test (in Week 31 with CloudFlare and W3 Total Cache), GoDaddy’s time was quicker at 574ms.
Checking in on the overall performance of changing from W3 Total Cache to WP Super Cache, the average response time across our 8 hosts in Week 31 was 1,335ms, while this week it has slowed even further to 1,736ms.
This is a concern as the speed of W3 Total Cache was much slower than WP Rocket before it. Let’s see if this is a 1 off or whether it continues going forward?
Next week we are testing from a Worldwide perspective, will these slow speeds continue?

And the Week 35 Winner is…
![]()
Uptime Rankings
After 30 weeks of testing, let’s summarize all the results to see how our 8 hosts are performing overall. It will also allow us to find out which host is currently leading our uptime challenge.


 Hi, I'm Clint!


Nice comparison. I need a fast host.
I’m glad you enjoyed the comparison Yogesh – good luck in finding a fast host 🙂