
Let’s finish the week with the ultimate speed test from Dallas…
Desktop Speed Test – Week 13 Method
- Compare 8 WordPress Hosts
- Use 8 Live Sites, each with a Different Host but with Identical Content (you can check them out here)
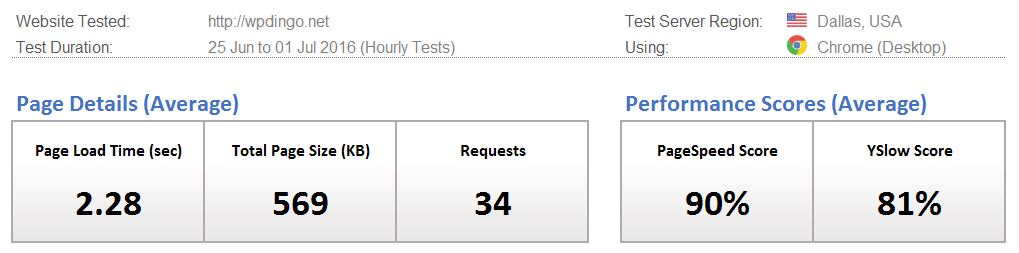
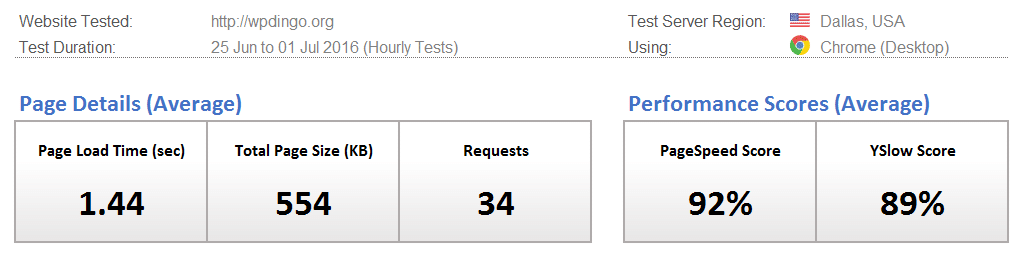
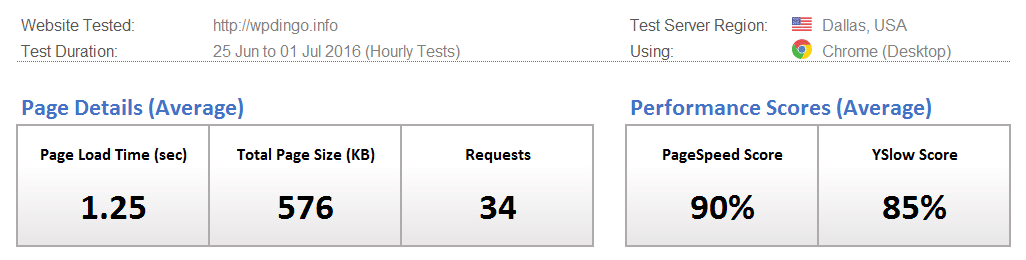
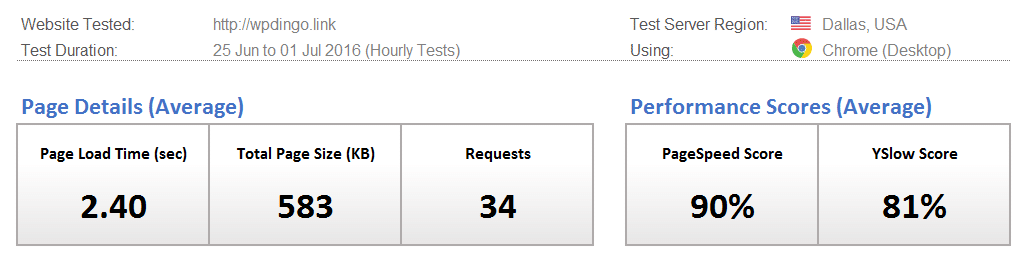
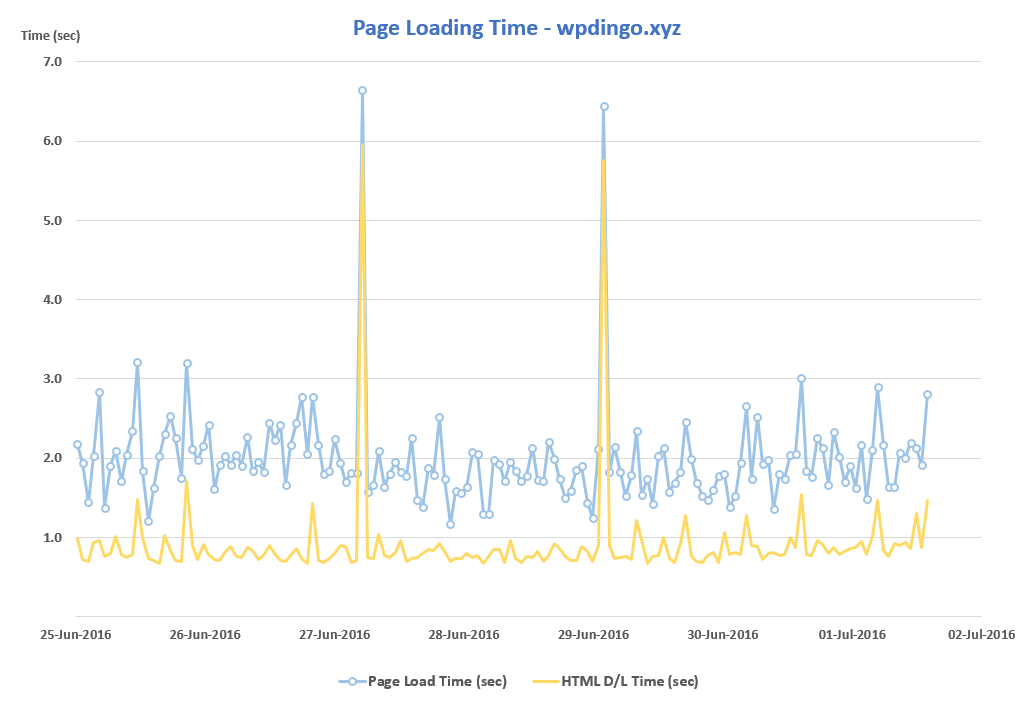
- Use GTmetrix Speed Test
![]()
- Location of Test: Dallas, USA
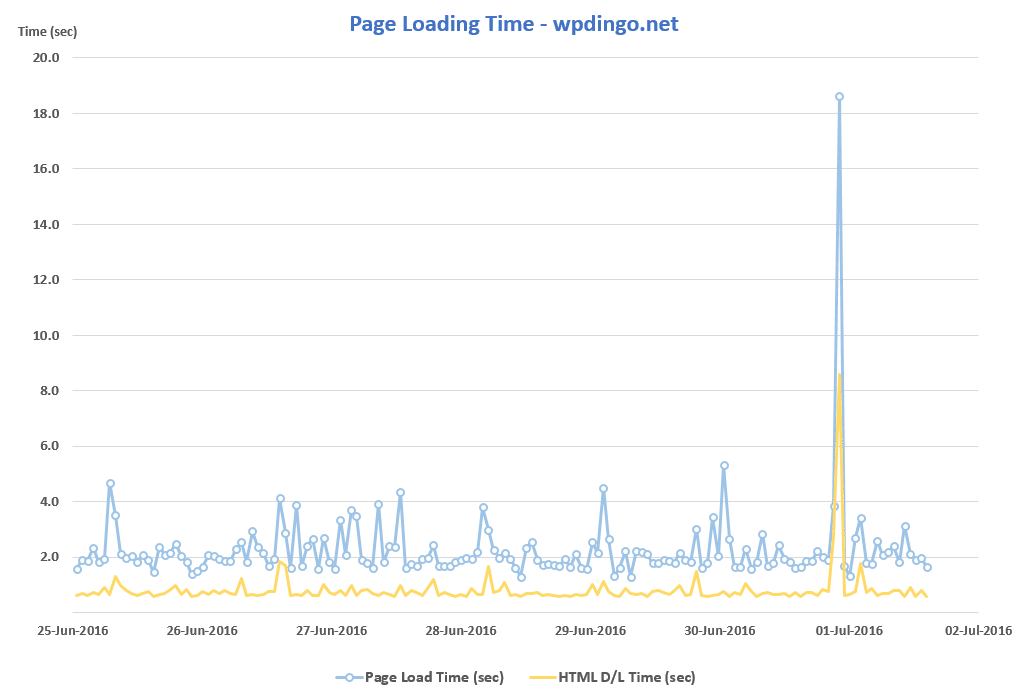
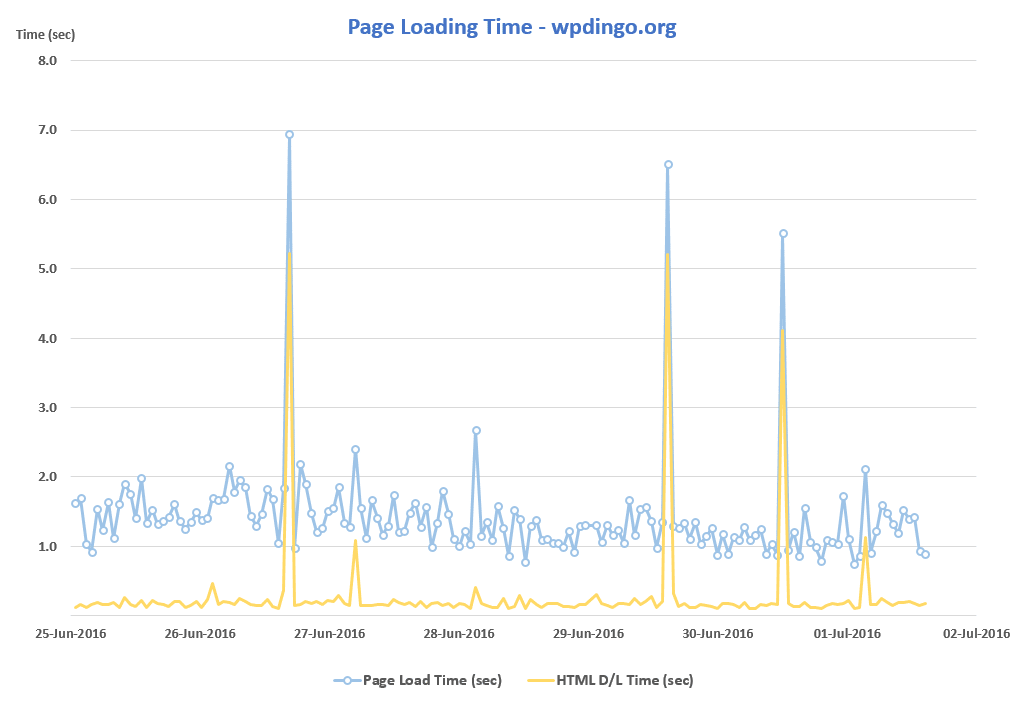
- Frequency of Testing: Every Hour for 7 Days
- Number of Weekly Tests = 1 x24 x7 x8 = 1,344 (xHours xDays xSites)
- Desktop Speed Testing is checking how long it takes for a website to fully load using a desktop internet browser
Which WordPress Host will conquer the Desktop Speed Test this week?
WordPress Hosts
Identical Live Sites
Weekly Tests
WordPress Host #1: SiteGround
WordPress Host #2: A2 Hosting
WordPress Host #3: GoDaddy
WordPress Host #4: DreamHost

WordPress Host #5: InMotion Hosting

WordPress Host #6: HostGator
WordPress Host #7: Bluehost

WordPress Host #8: Web Hosting Hub
Desktop Speed Test – Week 13 Summary Table
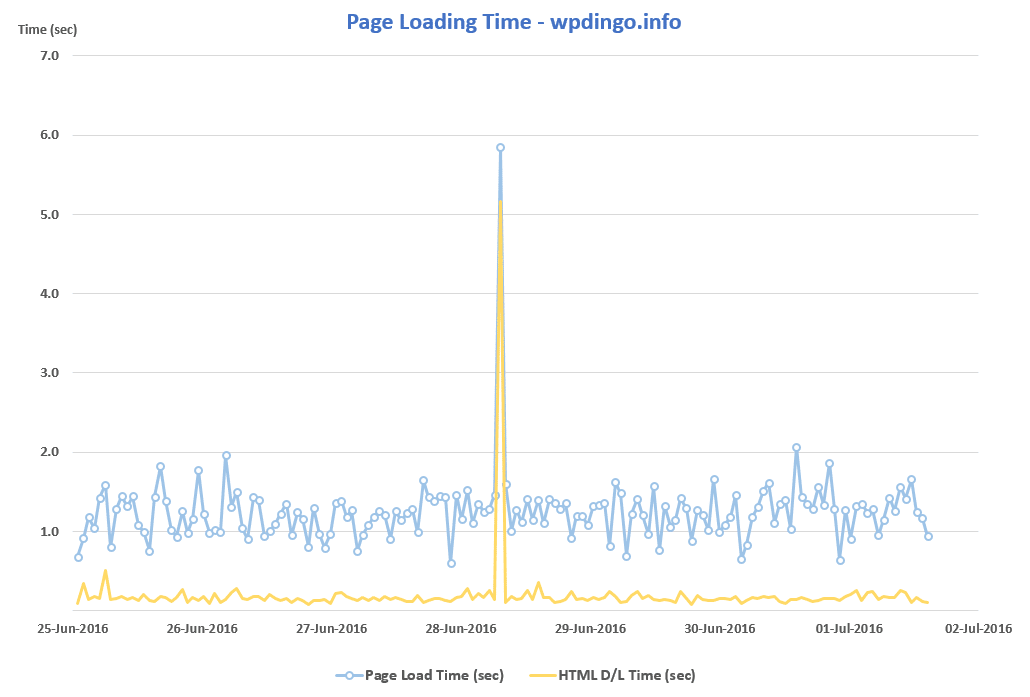
GoDaddy has crossed the line 1st in Dallas this week, making it 3 wins in a row! What’s even more remarkable is the Average Page Load Time of 1.25sec, which is a new record!!
After having control of this test in the first 10 weeks, A2 Hosting is now clearly being challenged by GoDaddy. How will these results impact the crucially important Desktop Speed Rankings?
The major changes from last week are:
- Web Hosting Hub just edging ahead of InMotion Hosting for 3rd place
- Bluehost crashing from 5th all the way to 8th
We will continue changing our test location each week, so that we can truly find out which host is performing best from a worldwide perspective. Next week we are off to London, where A2 Hosting has won both times. Will they be able to wrestle control back from GoDaddy?

For the 3rd Week in a Row,
the Weekly Winner is…
![]()
Desktop Speed Rankings
After 13 weeks of testing, I think it’s time to summarize all the results to see how our 8 hosts are performing overall. It will also allow us to find out which host is currently leading our desktop speed challenge.


 Hi, I'm Clint!


