
Which host is king of the speed jungle this week in Sydney?
Desktop Speed Test – Week 44 Method
- Compare 8 WordPress Hosts
- Use 8 Live Sites, each with a Different Host but with Identical Content (you can check them out here)
- Use GTmetrix Speed Test
![]()
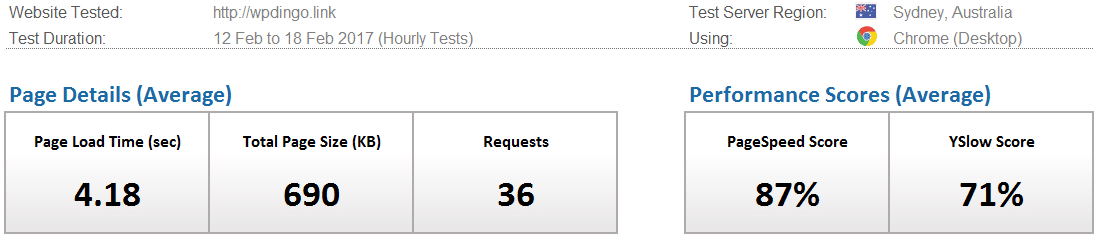
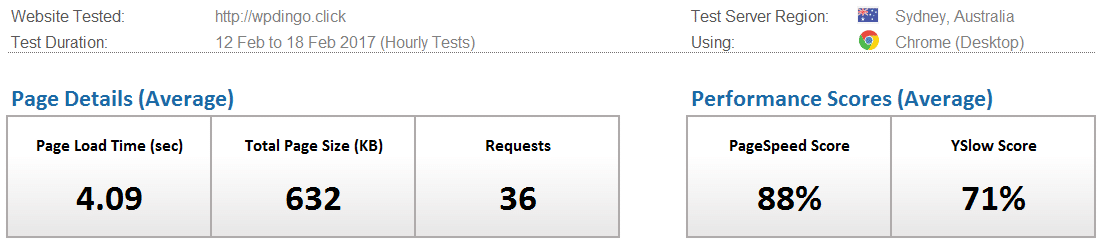
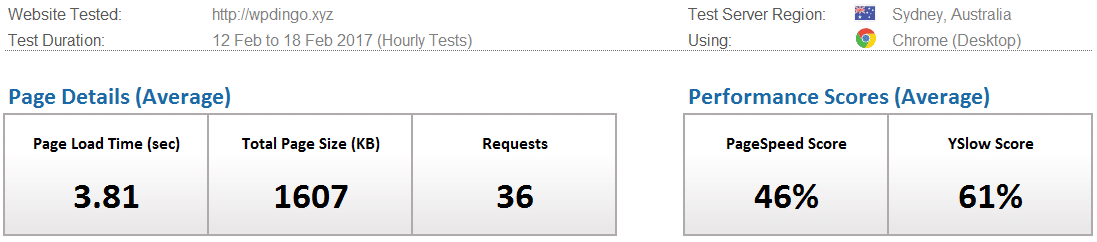
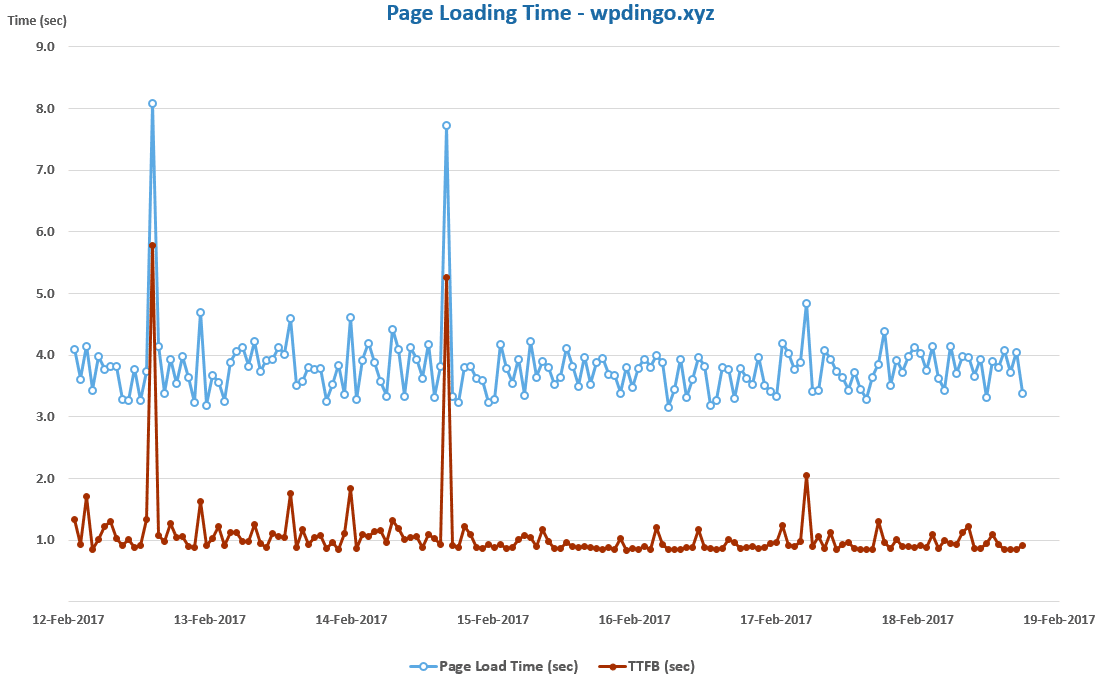
- Location of Test: Sydney, Australia
- Frequency of Testing: Every Hour for 7 Days
- Number of Weekly Tests = 1 x24 x7 x8 = 1,344 (xHours xDays xSites)
- Desktop Speed Testing is checking how long it takes for a website to fully load using a desktop internet browser
Which WordPress Host will conquer the Desktop Speed Test this week?
WordPress Hosts
Identical Live Sites
Weekly Tests
WordPress Host #1: SiteGround

WordPress Host #2: Namecheap
WordPress Host #3: GoDaddy
WordPress Host #4: DreamHost

WordPress Host #5: InMotion Hosting
WordPress Host #6: HostGator
WordPress Host #7: Bluehost
WordPress Host #8: Web Hosting Hub
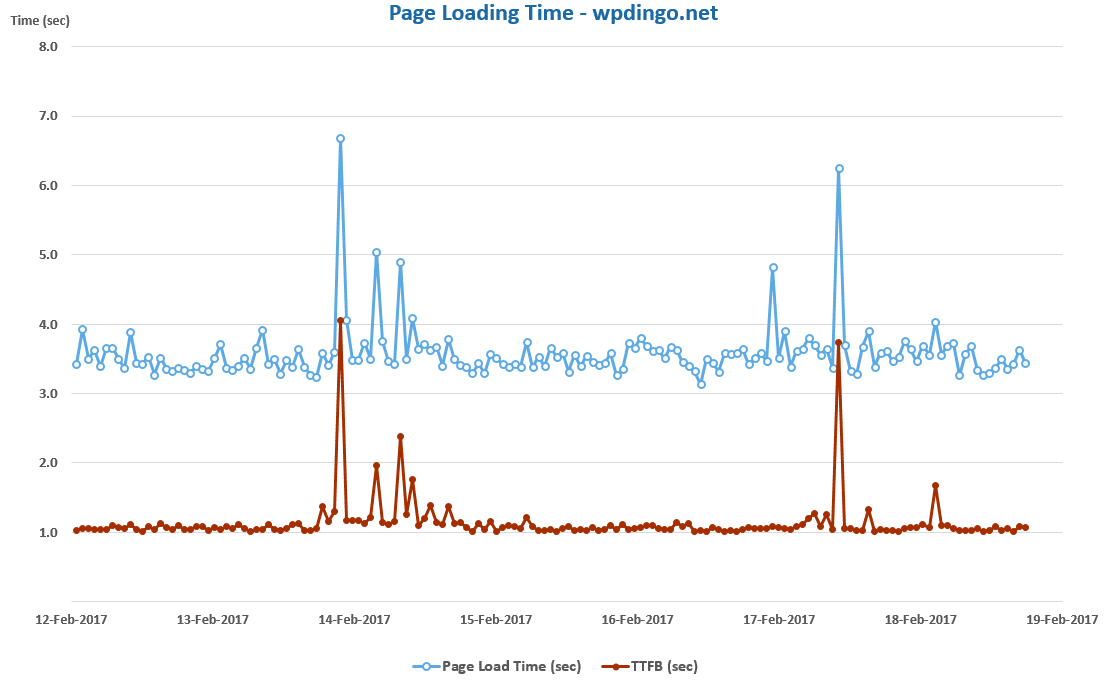
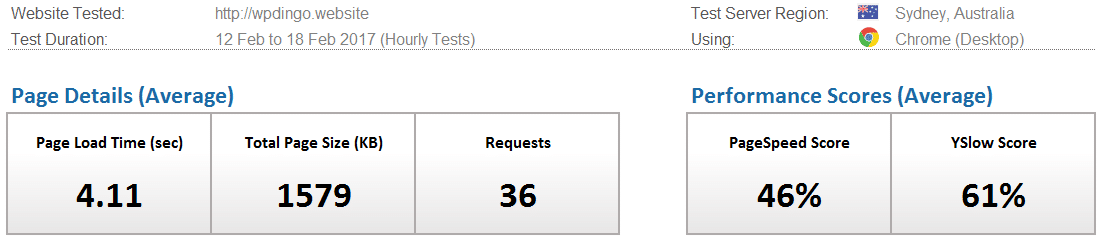
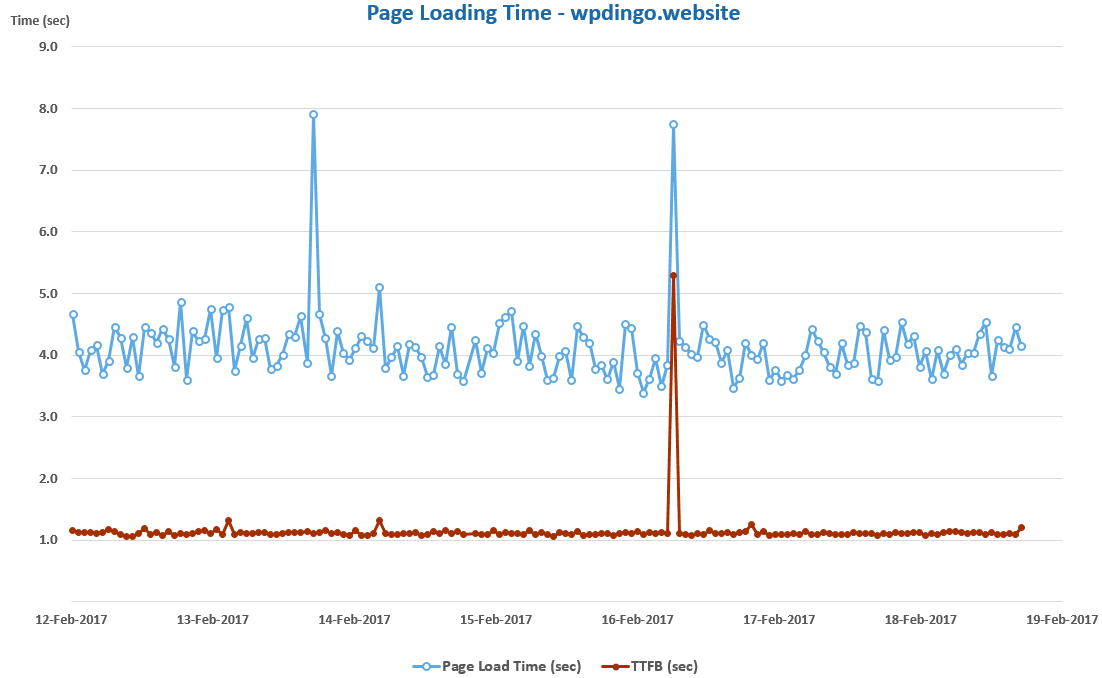
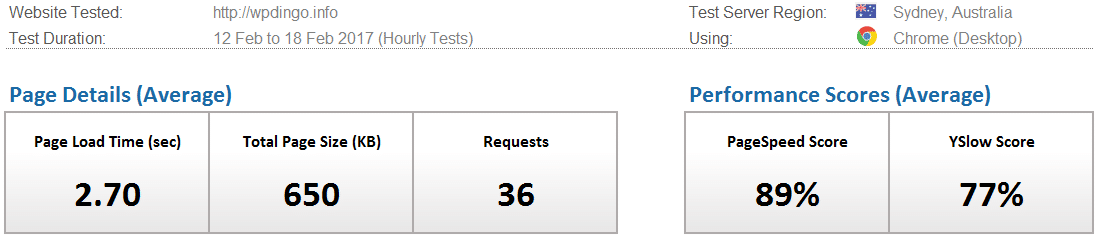
Desktop Speed Test – Week 44 Summary Table
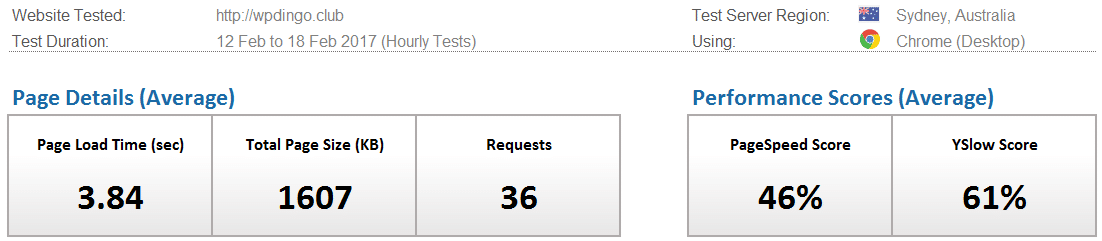
The winner this week is GoDaddy with a time of 2.70s. This time is well off the Sydney record of 1.03s set by Bluehost in Week 27.
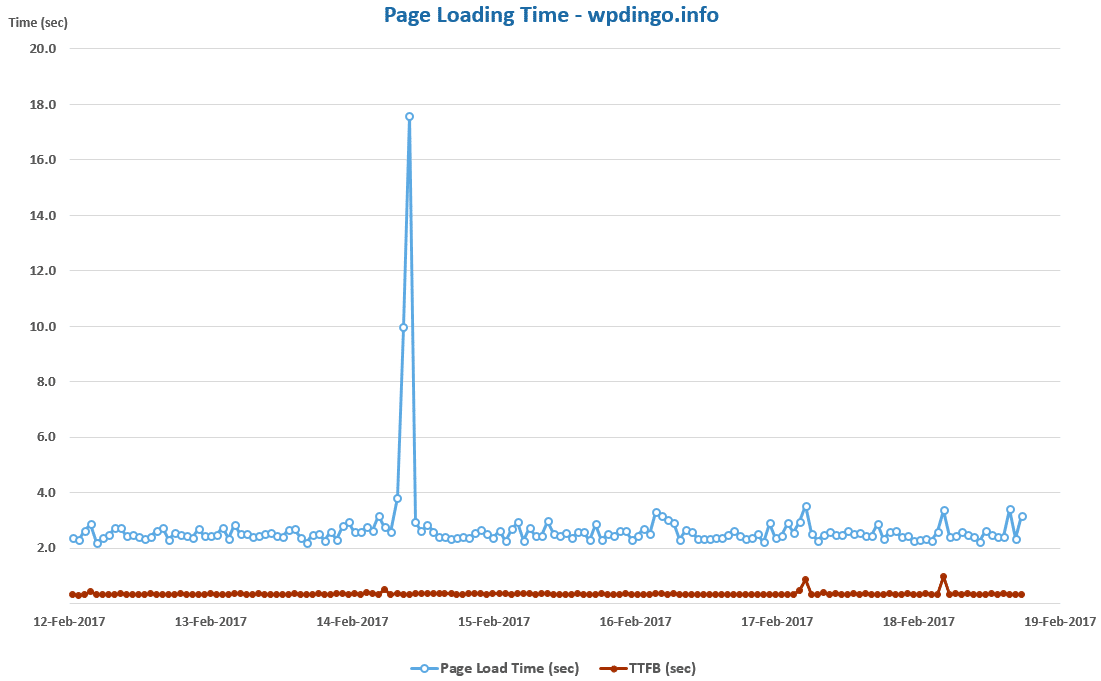
On our last visit to Sydney with No Optimizations setup (in Week 41), the average page load time for our 8 hosts was 4.03s. This week with Imagify added, the average load time is slightly faster at 3.83s.
This is the third and final week of our Imagify Speed Study and that means it time to summarize all the results and see what the verdict is on Imagify’s speed impact.
Next week we’re off to Dallas, where there will be a different image optimizer setup. The record load time in Dallas is 1.02s, set by HostGator in Week 21, is it possible for these records to be challenged?

And the Week 44 Winner is…
![]()
Desktop Speed Rankings
After 9 months of testing, let’s summarize all the results to see how our 8 hosts are performing overall. It will also allow us to find out which host is currently leading our desktop speed challenge.


 Hi, I'm Clint!


