
With W3 Total Cache all fired up, let’s see which hosts are galloping away from the field this week in London?
Desktop Speed Test – Week 58 Method
- Compare 8 WordPress Hosts
- Use 8 Live Sites, each with a Different Host but with Identical Content (you can check them out here)
- Use GTmetrix Speed Test
![]()
- Location of Test: London, UK
- Frequency of Testing: Every Hour for 7 Days
- Number of Weekly Tests = 1 x24 x7 x8 = 1,344 (xHours xDays xSites)
- Desktop Speed Testing is checking how long it takes for a website to fully load using a desktop internet browser
Which WordPress Host will conquer the Desktop Speed Test this week?
WordPress Hosts
Identical Live Sites
Weekly Tests
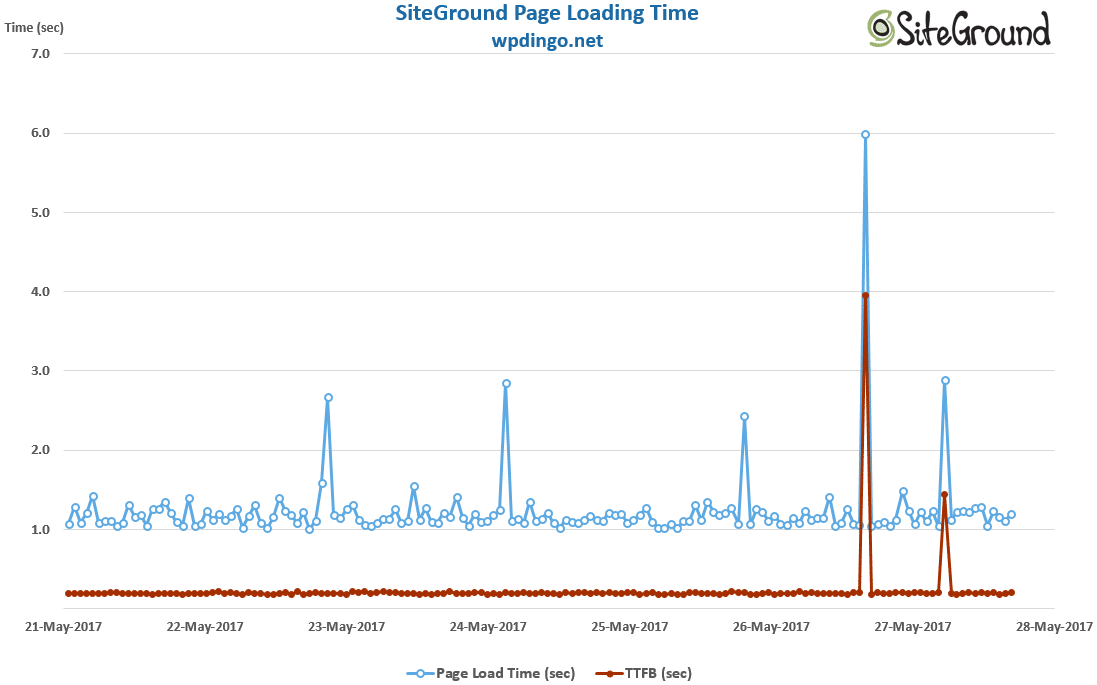
WordPress Host #1: SiteGround

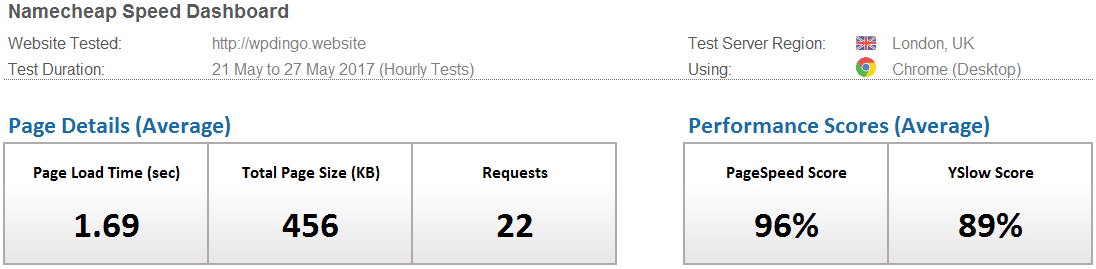
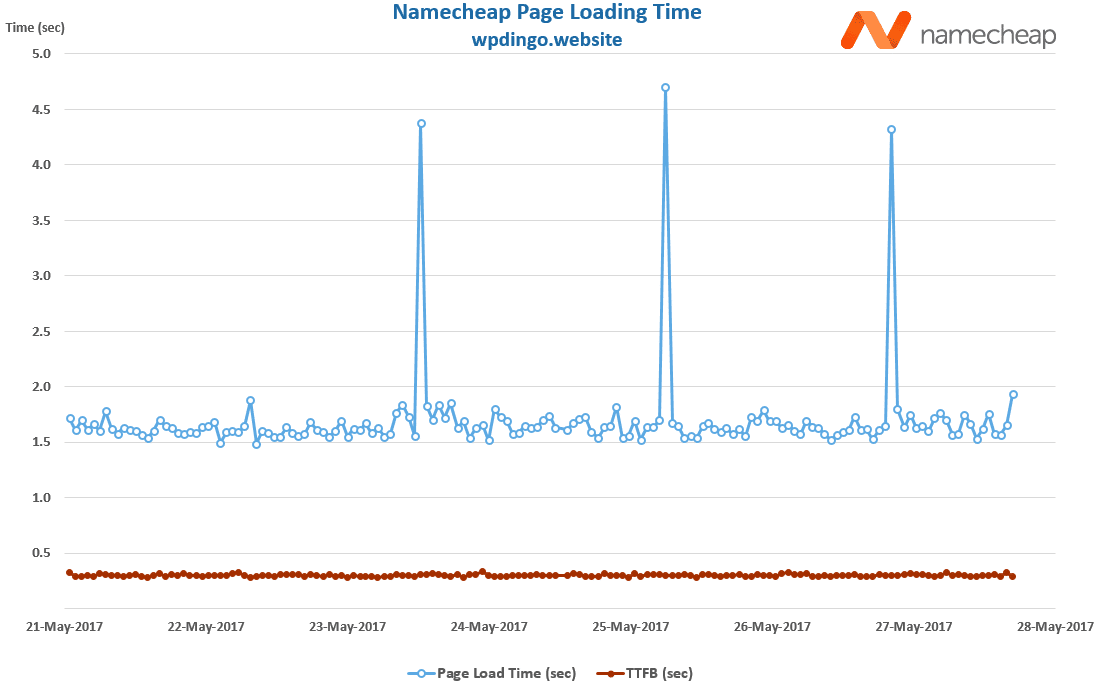
WordPress Host #2: Namecheap
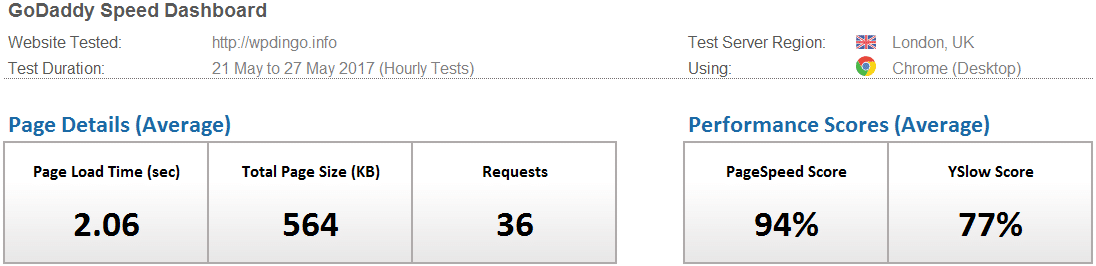
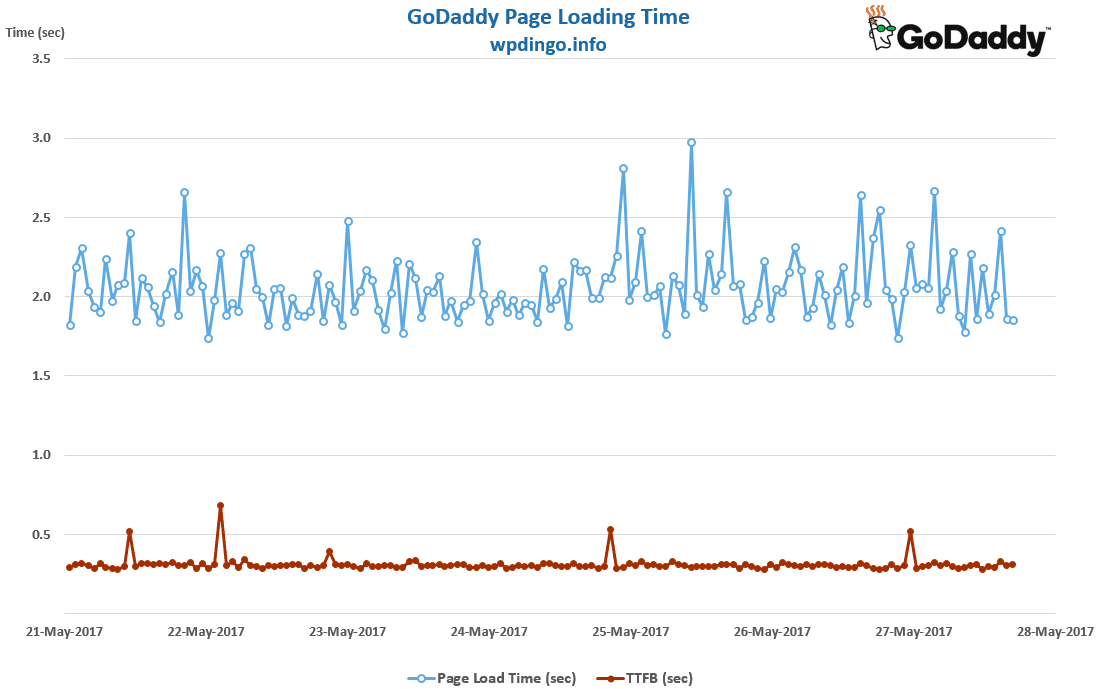
WordPress Host #3: GoDaddy
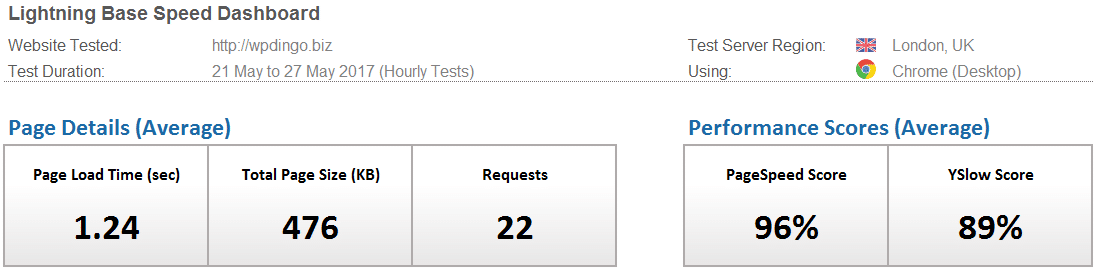
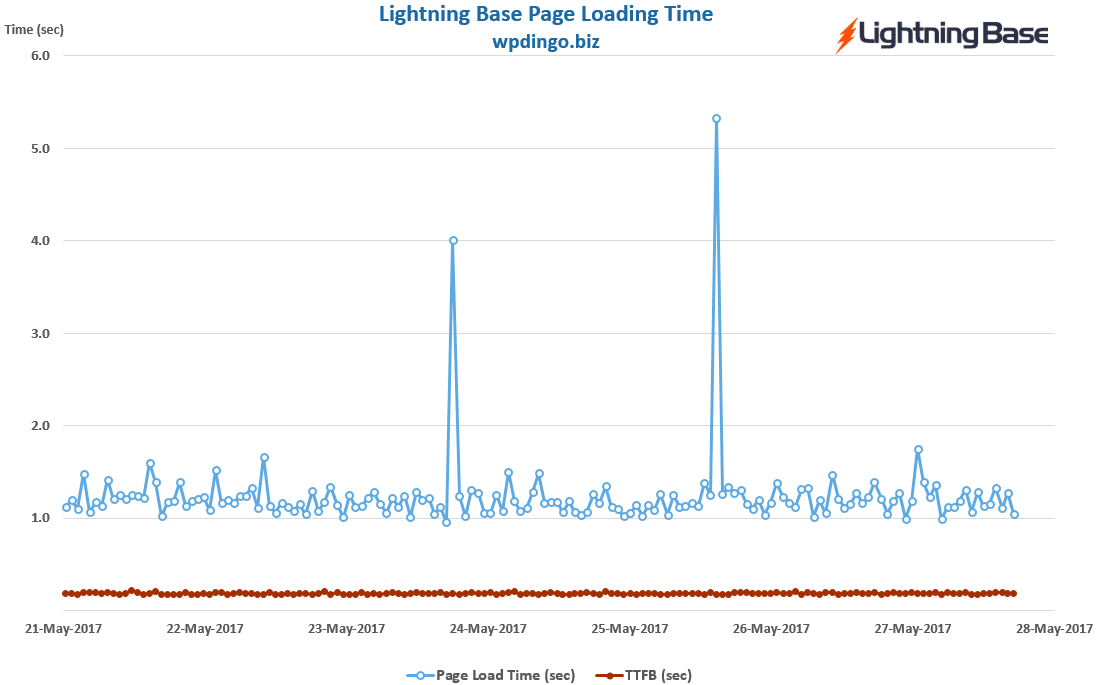
WordPress Host #4: Lightning Base
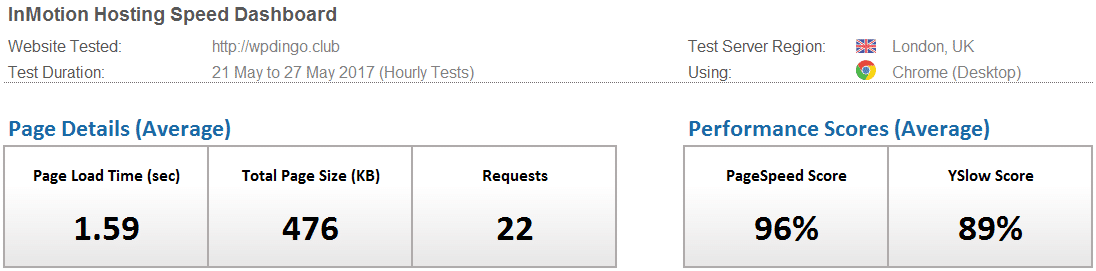
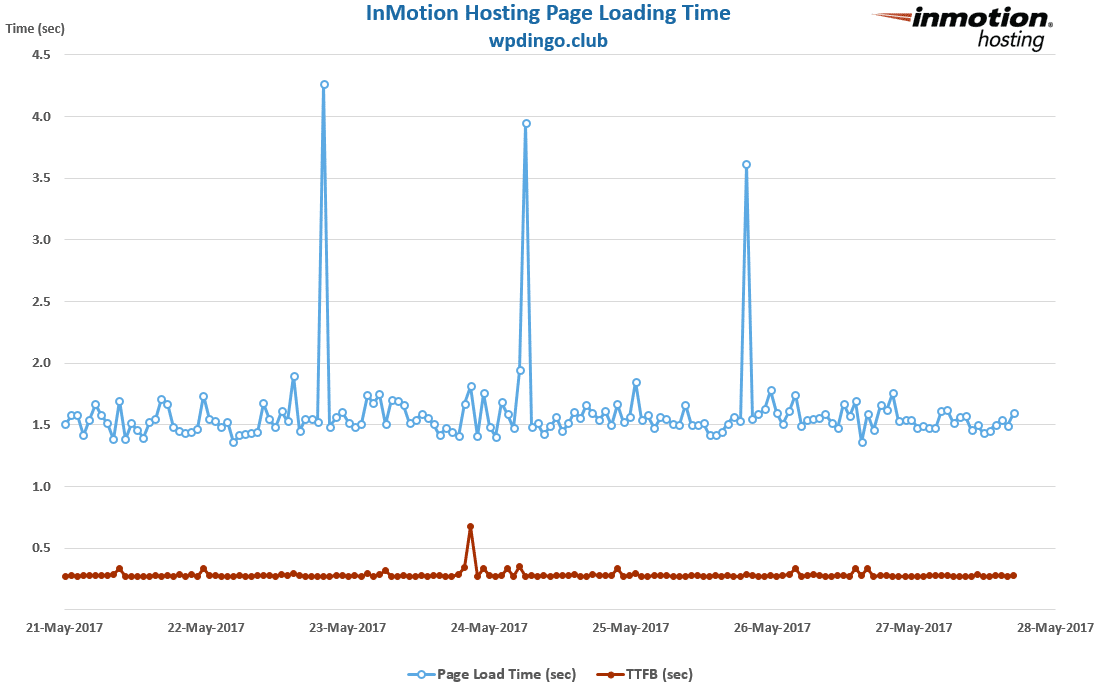
WordPress Host #5: InMotion Hosting
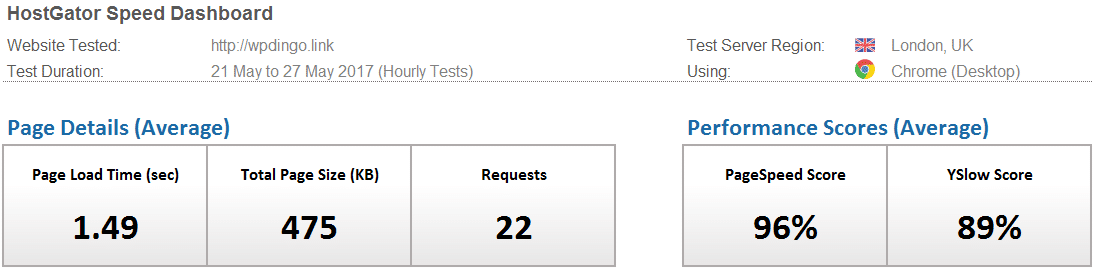
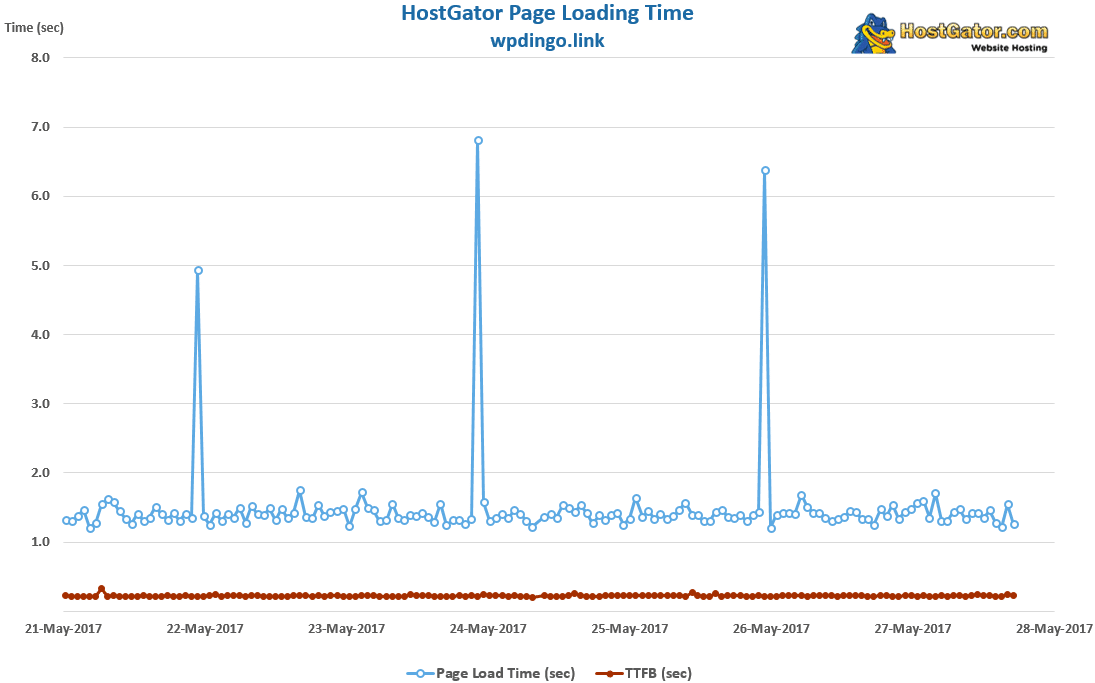
WordPress Host #6: HostGator
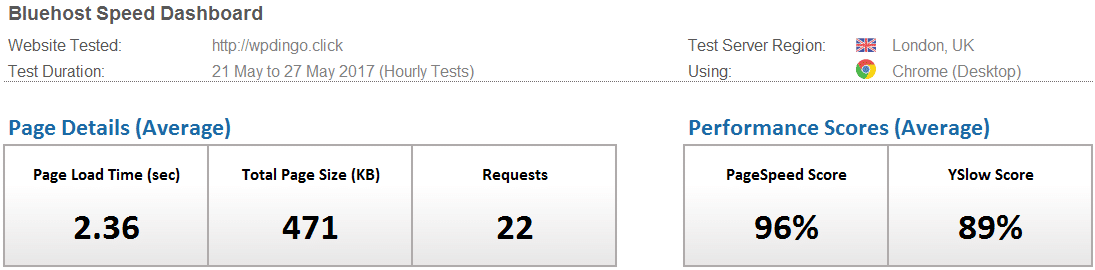
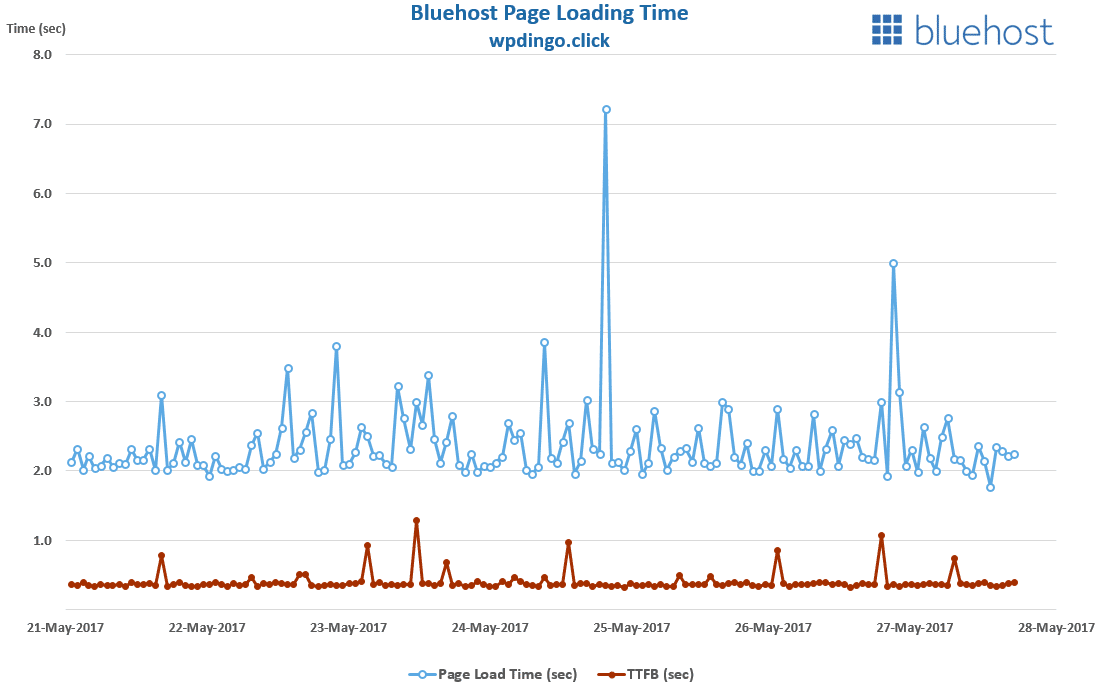
WordPress Host #7: Bluehost
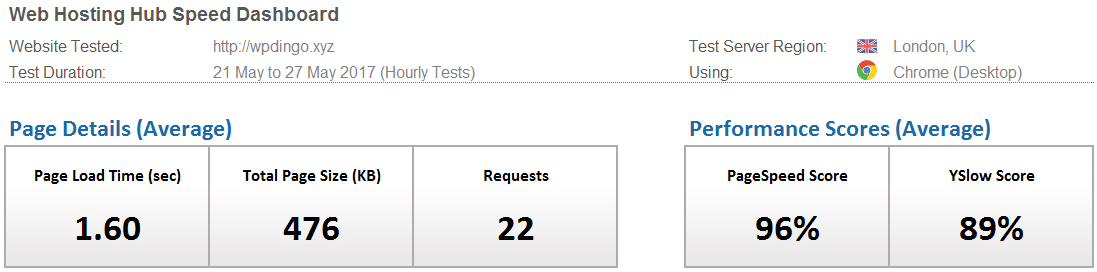
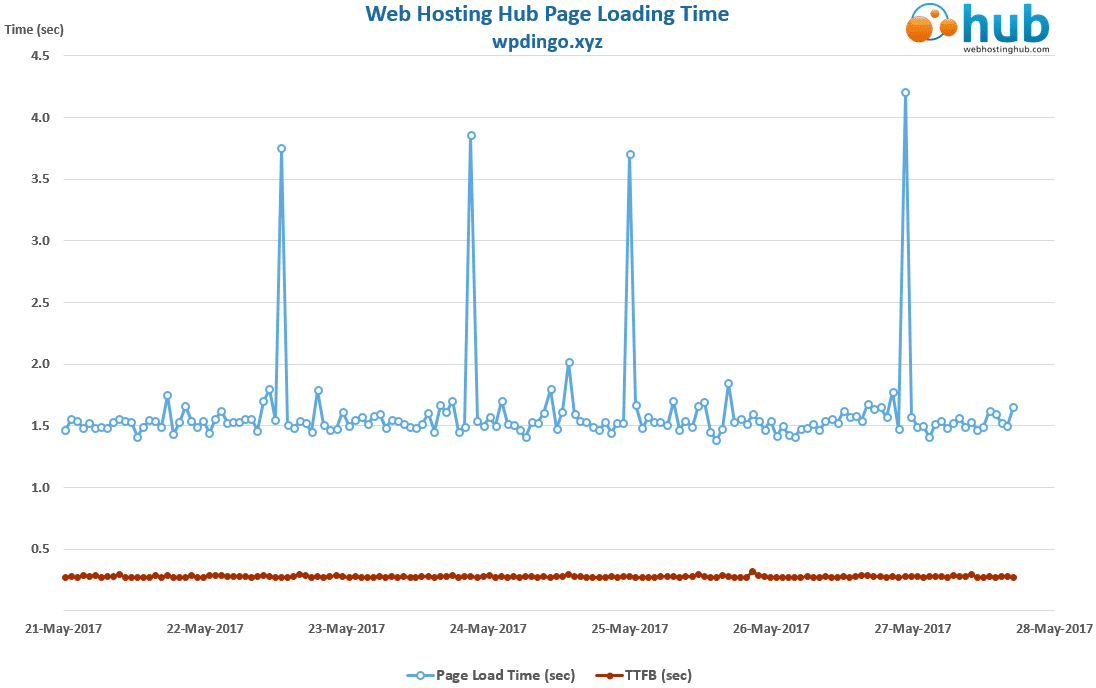
WordPress Host #8: Web Hosting Hub
Desktop Speed Test – Week 58 Summary Table
The winner this week is SiteGround with a time of 1.23s, just ahead of Lightning Base at 1.24s. SiteGround’s time is fairly close to the London record of 0.92s set by DreamHost in Week 30.
On our last visit to London with WP Super Cache setup (in Week 55), the average load time for our 8 hosts was 2.35s. This week with W3 Total Cache, the average load time is significantly faster at 1.66s.
This is the second week of our W3 Total Cache Speed Study and the early signs are W3 Total Cache is comfortably outperforming WP Super Cache.
Next week we’re changing our test location to Sydney, will W3 Total Cache’s dominance continue?

And the Week 58 Winner is…
![]()
Desktop Speed Rankings
After 12 months of testing, let’s summarize all the results to see how our 8 hosts are performing overall. It will also allow us to find out which host is currently leading our desktop speed challenge.


 Hi, I'm Clint!


