
With MaxCDN now combined with WP Rocket & Cloudflare, which host is showing real speed this week in Dallas?
Desktop Speed Test – Week 81 Method
- Compare 8 WordPress Hosts
- Use 8 Live Sites, each with a Different Host but with Identical Content (you can check them out here)
- Use GTmetrix Speed Test
![]()
- Location of Test: Dallas, USA
- Frequency of Testing: Every Hour for 7 Days
- Number of Weekly Tests = 1 x24 x7 x8 = 1,344 (xHours xDays xSites)
- Desktop Speed Testing is checking how long it takes for a website to fully load using a desktop internet browser
Which WordPress Host will conquer the Desktop Speed Test this week?
WordPress Hosts
Identical Live Sites
Weekly Tests
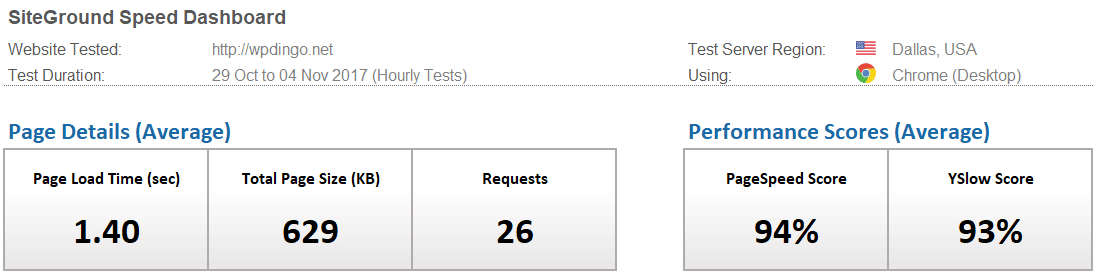
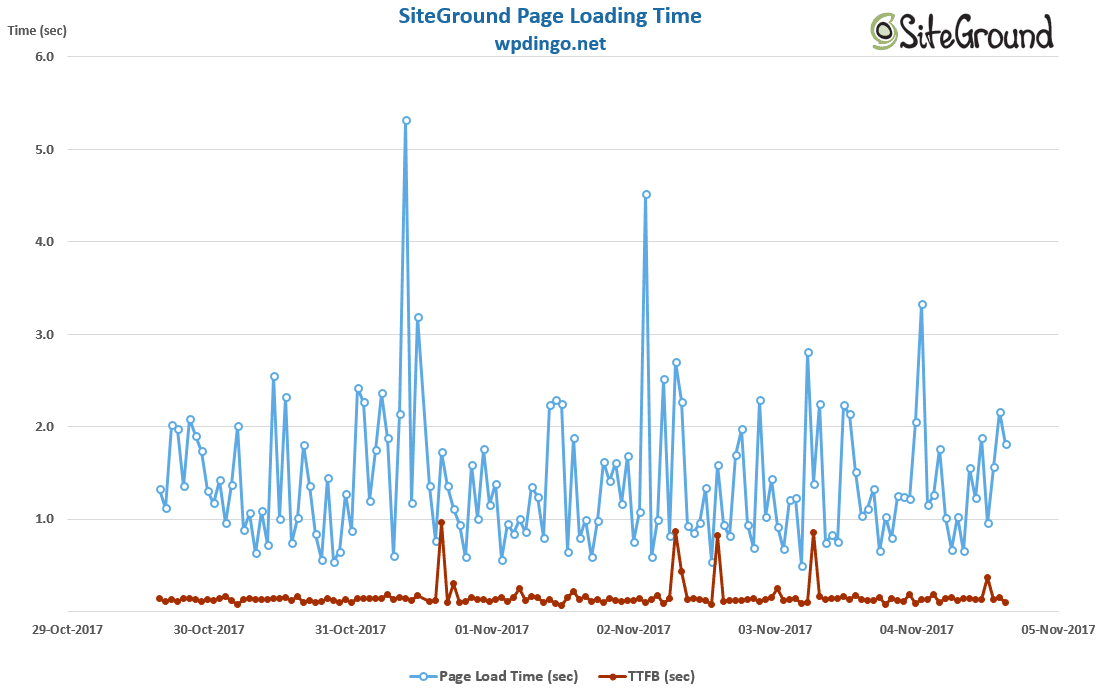
WordPress Host #1: SiteGround
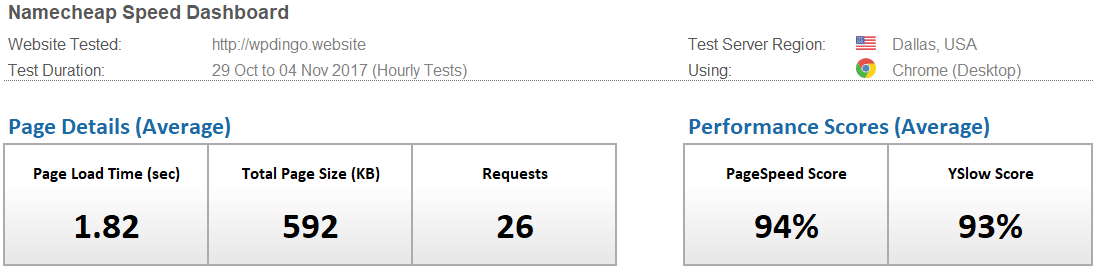
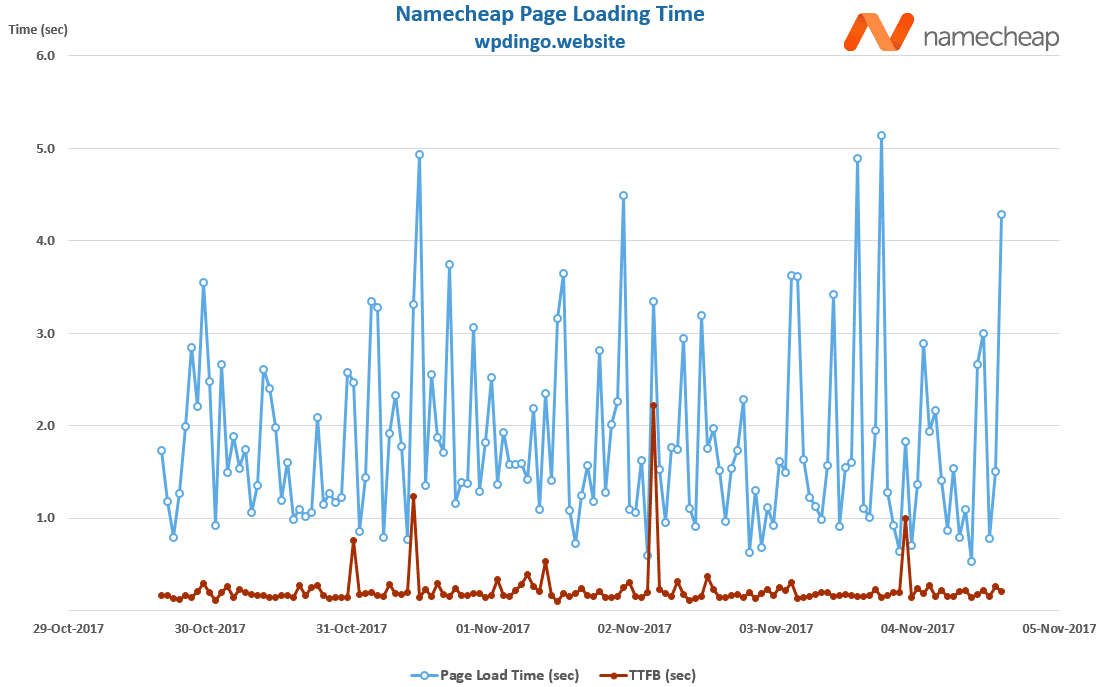
WordPress Host #2: Namecheap
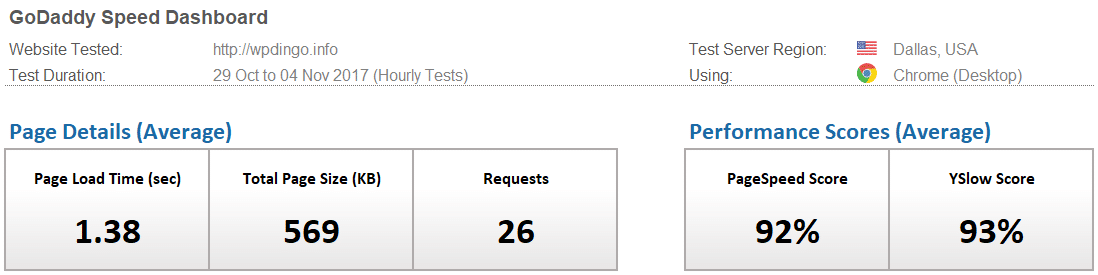
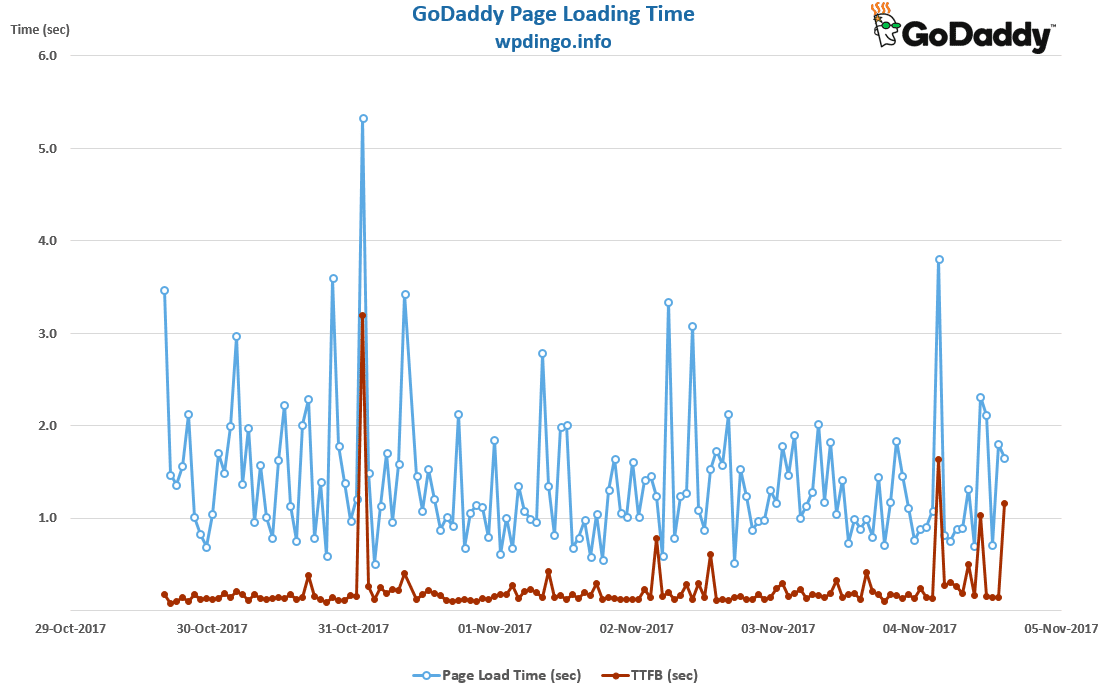
WordPress Host #3: GoDaddy
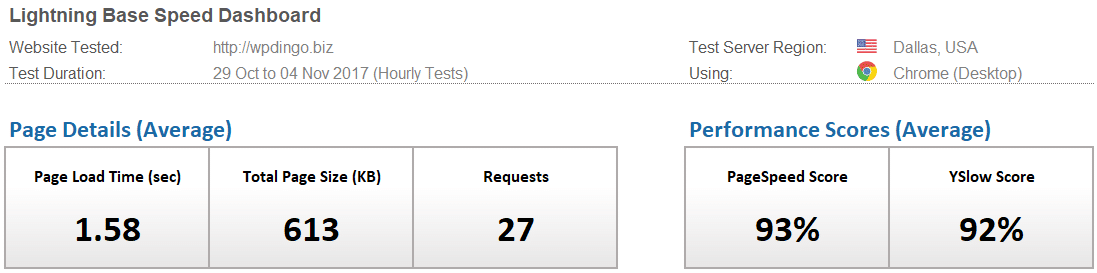
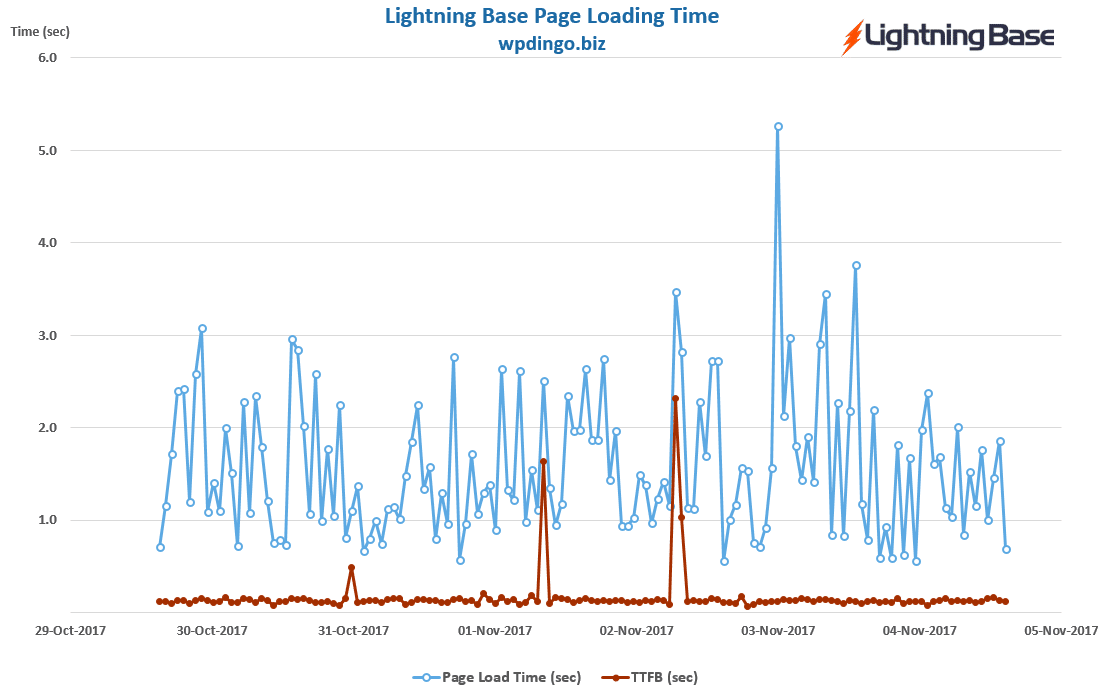
WordPress Host #4: Lightning Base
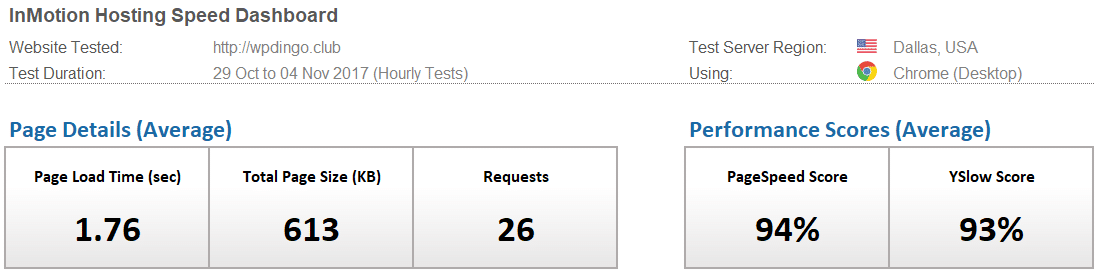
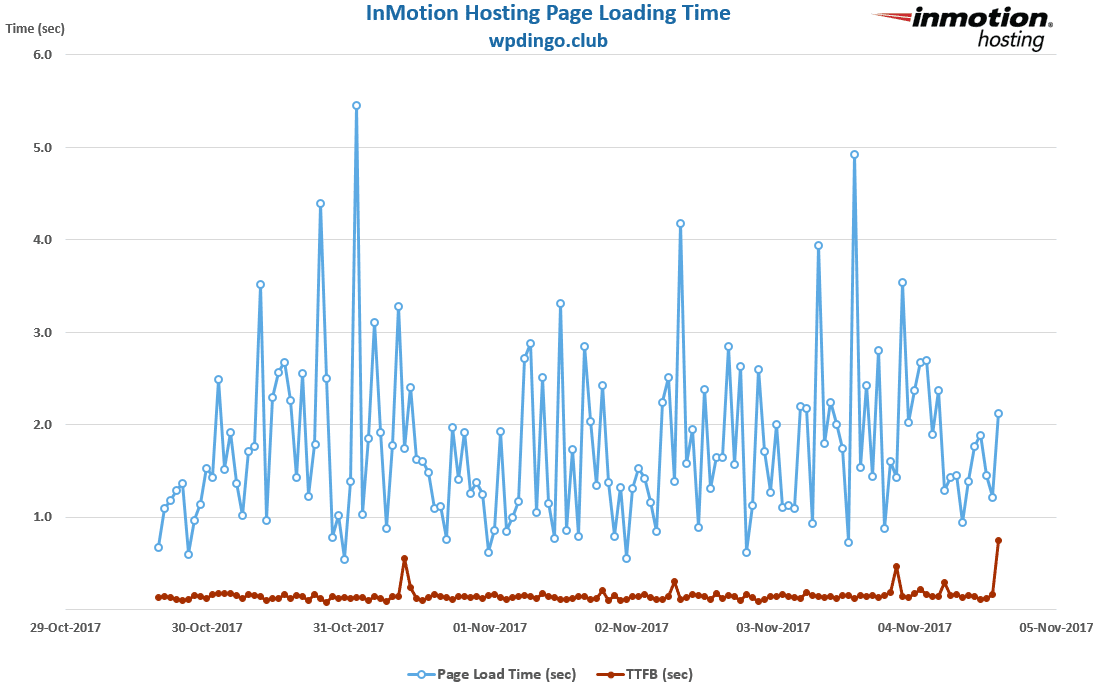
WordPress Host #5: InMotion Hosting
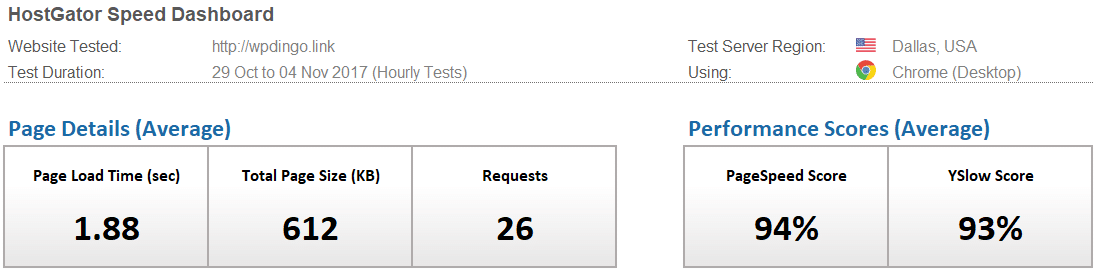
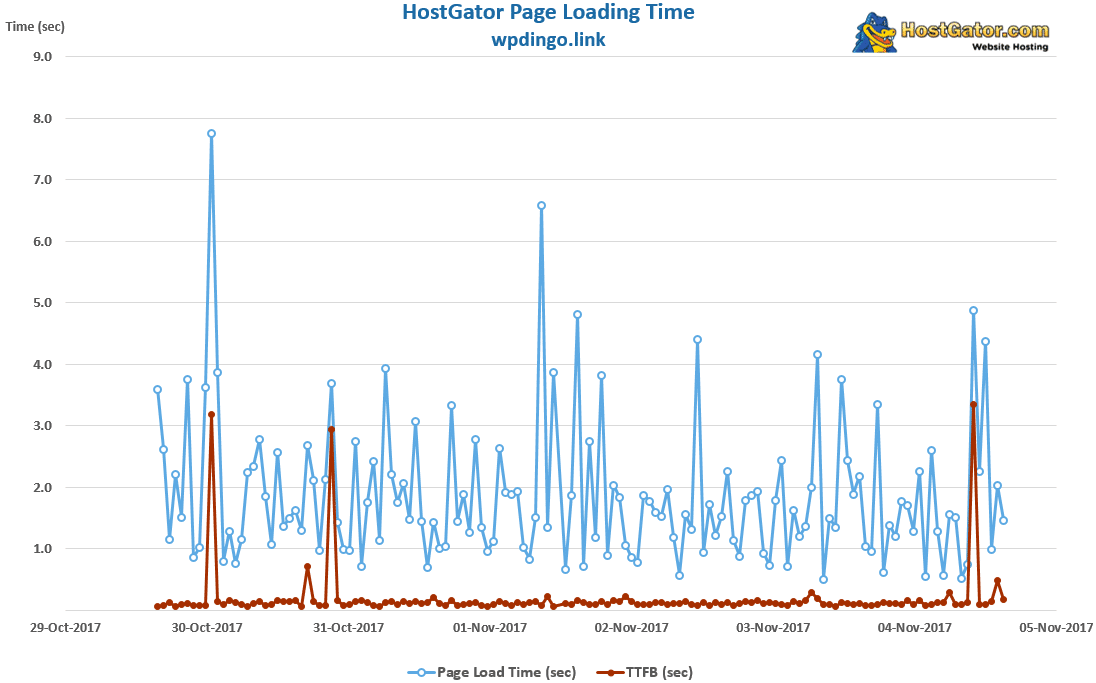
WordPress Host #6: HostGator
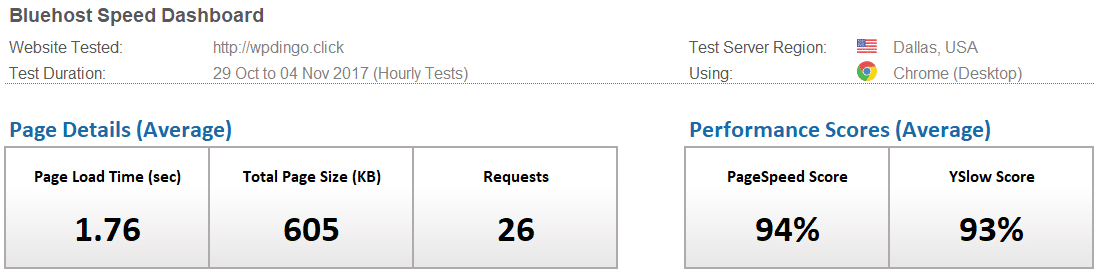
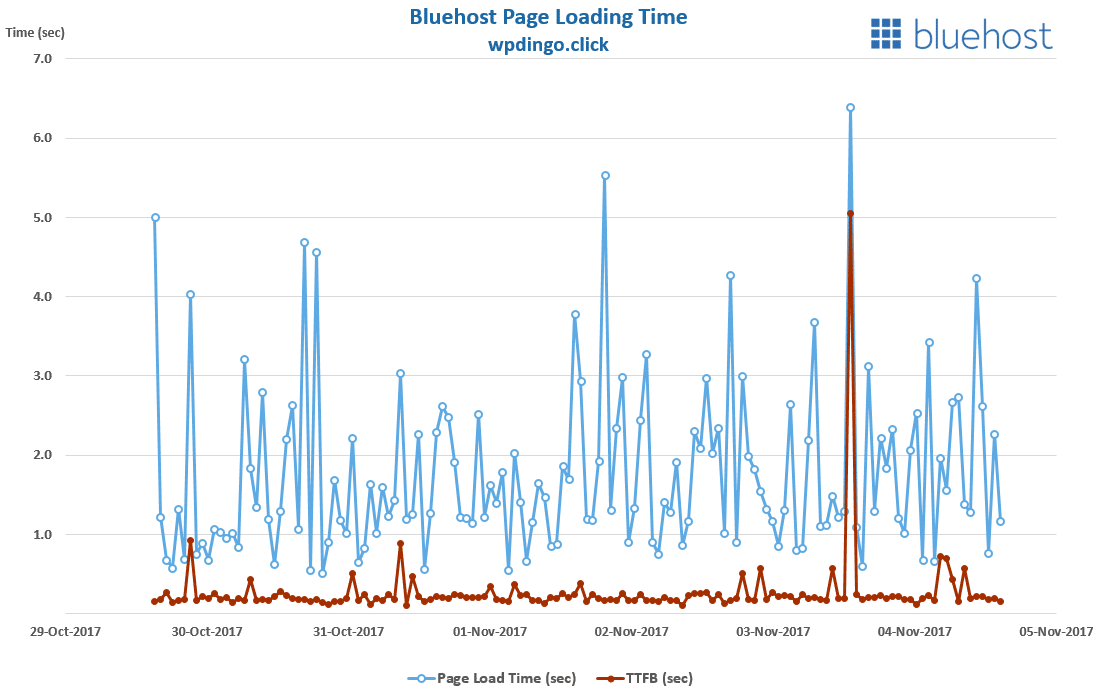
WordPress Host #7: Bluehost
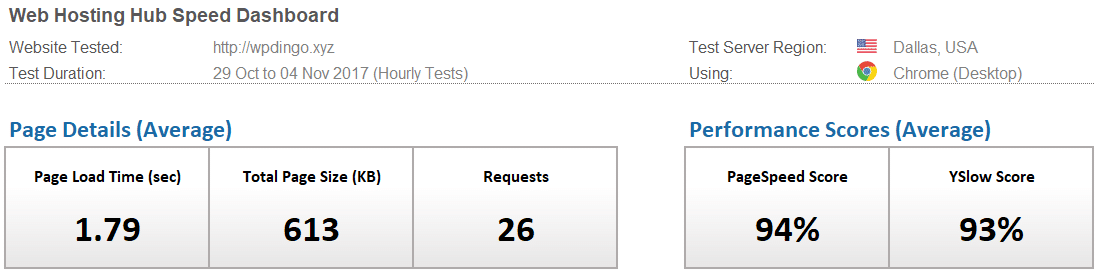
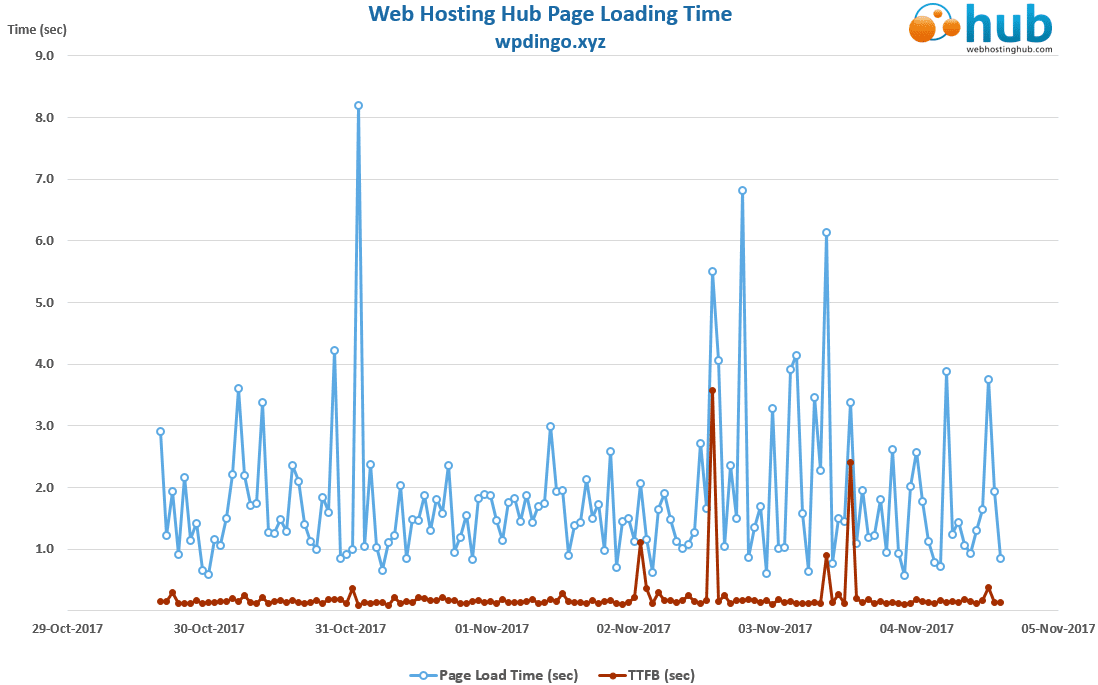
WordPress Host #8: Web Hosting Hub
Desktop Speed Test – Week 81 Summary Table
The winner this week is GoDaddy with a time of 1.38s, which is well behind the all time Dallas record, which was set by SiteGround in Week 78.
On our last visit to Dallas with KeyCDN, Cloudflare & WP Rocket setup (in Week 78), the average load time for our 8 hosts was 0.84s. This week with MaxCDN replacing KeyCDN, the average load time is ridiculously slower at 1.67s.
This is the first week of our MaxCDN, Cloudflare & WP Rocket Speed Study, and the early signs are showing MaxCDN falling well behind the performance of KeyCDN.
Next week we’ll be switching up the test location to London. I wonder whether MaxCDN will be able to recover from this very poor start?

And this Week’s Winner is…
![]()
Desktop Speed Rankings
After 18 months of testing, let’s summarize all the results to see how our 8 hosts are performing overall. It will also allow us to find out which host is currently leading our desktop speed challenge.


 Hi, I'm Clint!


