
Let’s see which of our hosts are up and about this week in North America?
Uptime Test – Week 37 Method
- Compare 8 WordPress Hosts
- Use 8 Live Sites, each with a Different Host but with Identical Content (you can check them out here)
- Use Pingdom Uptime Test
![]()
- Location of Test: 10 North American Locations
- Frequency of Testing: Every Minute across the Last 7 Days
- Number of Weekly Tests = 1 x60 x24 x7 x8 = 80,640 (xMinutes xHours xDays xSites)
- Uptime testing is confirming that the website is actually accessible to visitors
- An example of why an outage (or downtime) can occur is scheduled maintenance of the server the website is hosted on
Which WordPress Hosts can ace the uptime test this week?
WordPress Hosts
Identical Live Sites
Weekly Tests
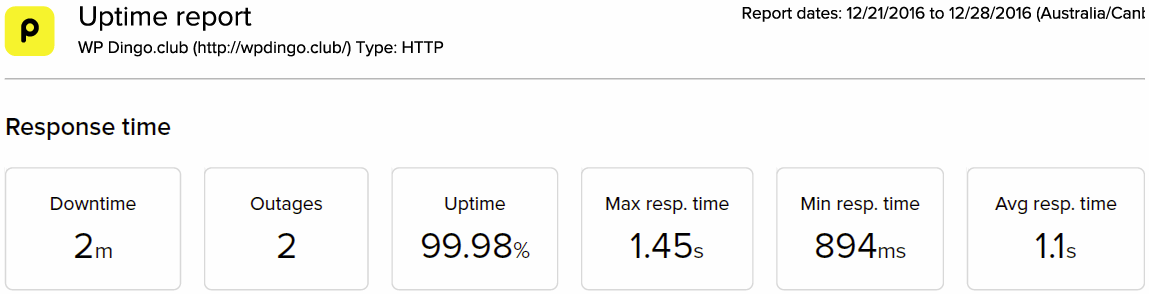
WordPress Host #1: SiteGround

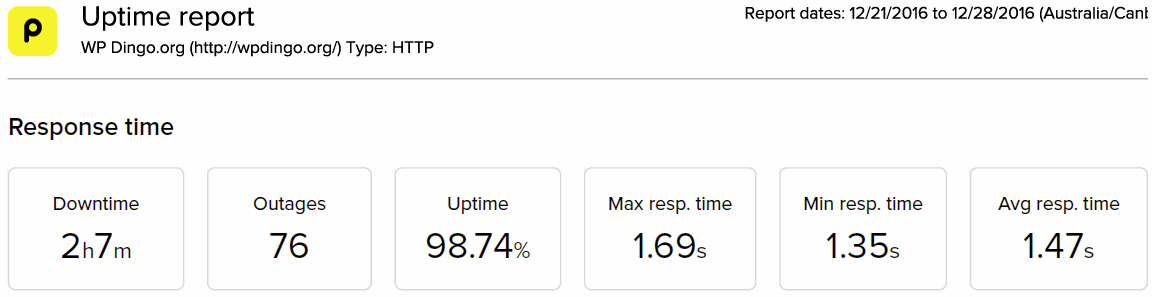
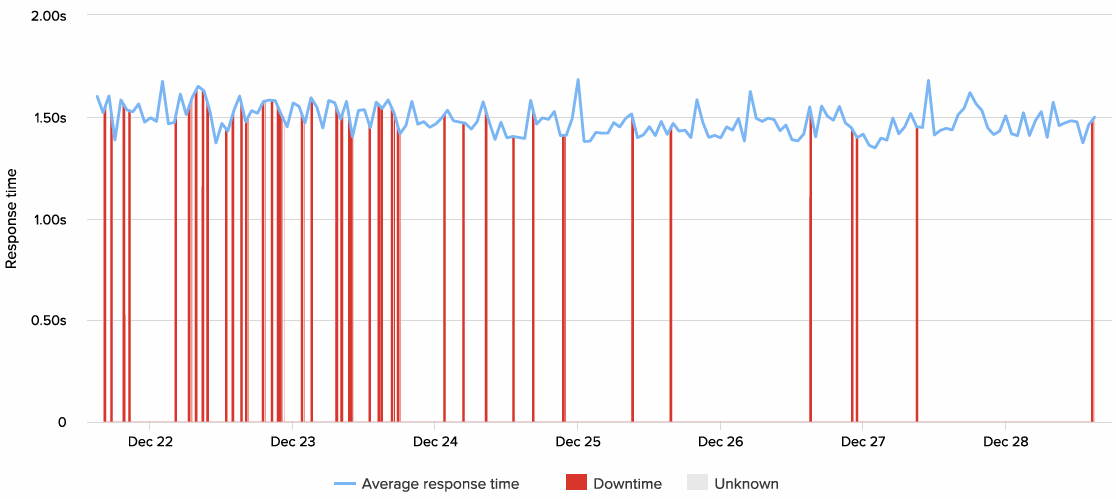
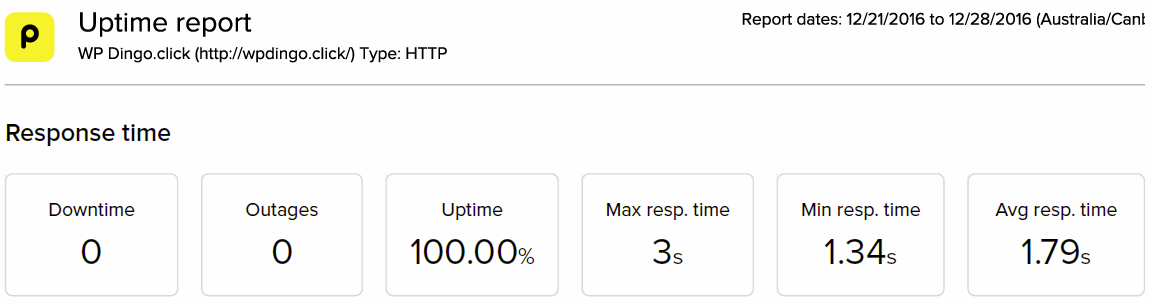
WordPress Host #2: A2 Hosting
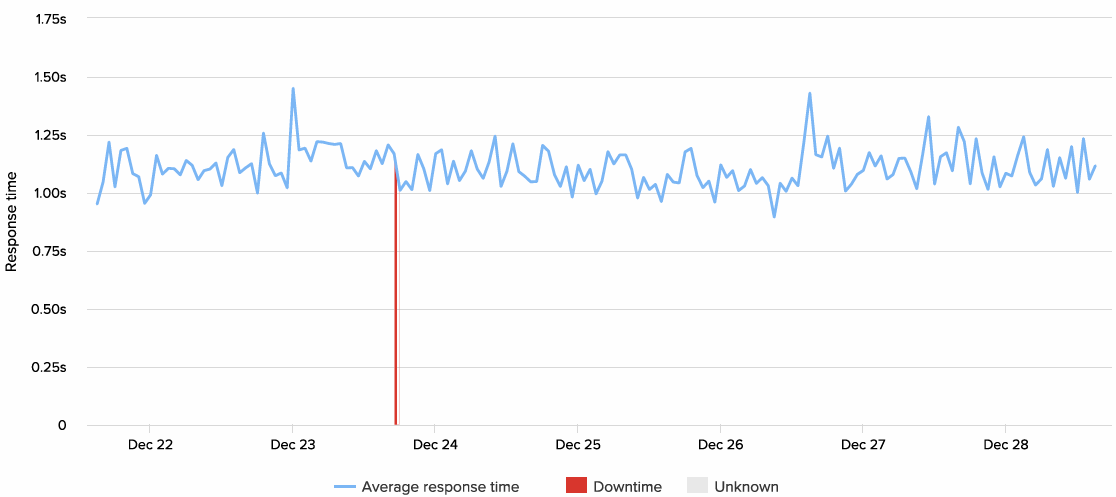
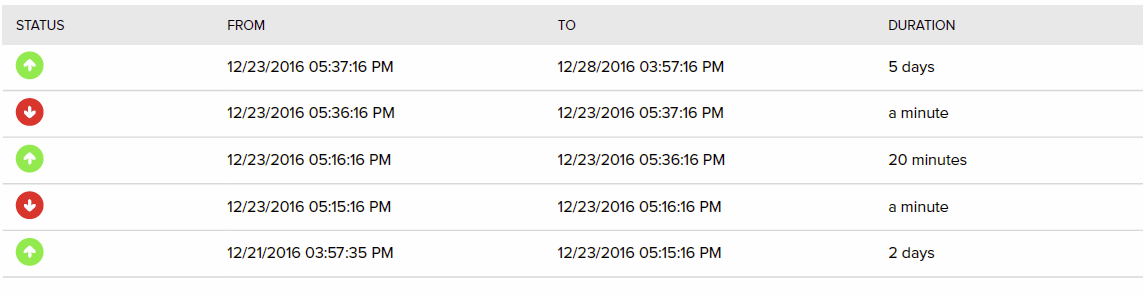
A sample of the Uptime Status (Over 6 pages in total):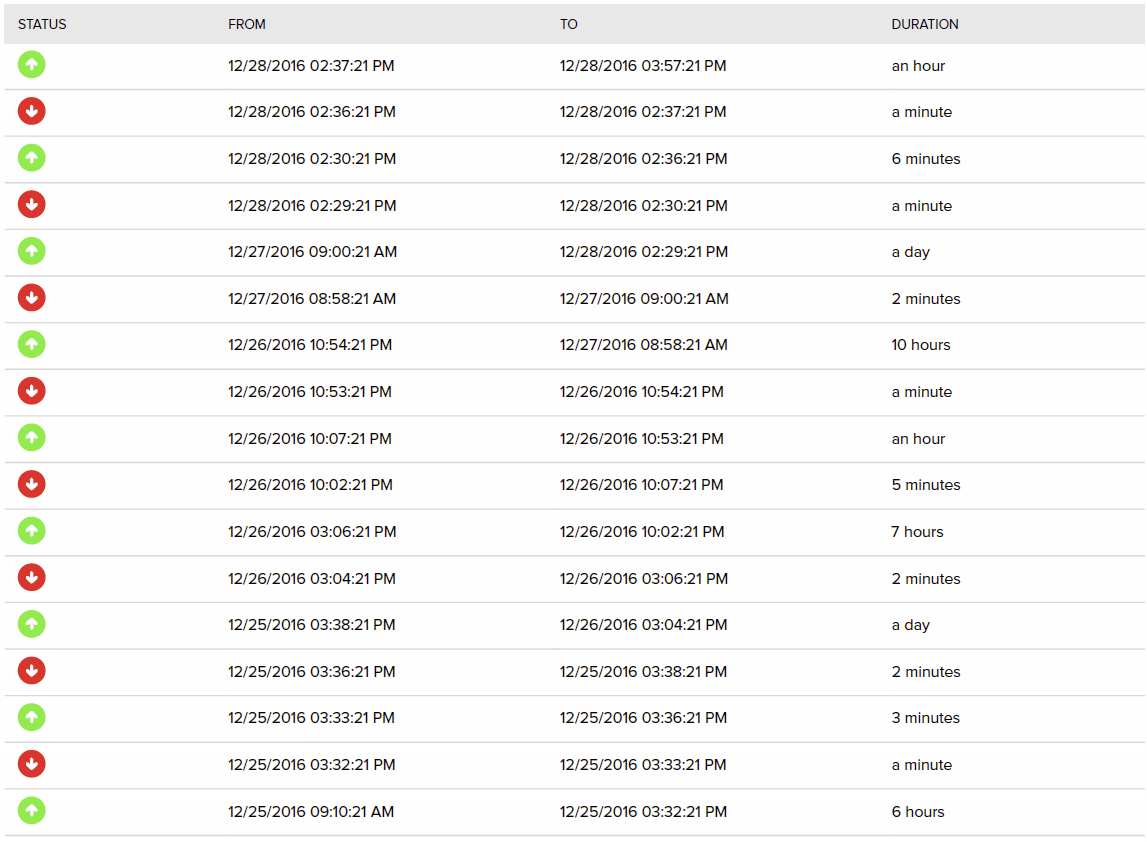
WordPress Host #3: GoDaddy

WordPress Host #4: DreamHost


WordPress Host #5: InMotion Hosting
WordPress Host #6: HostGator
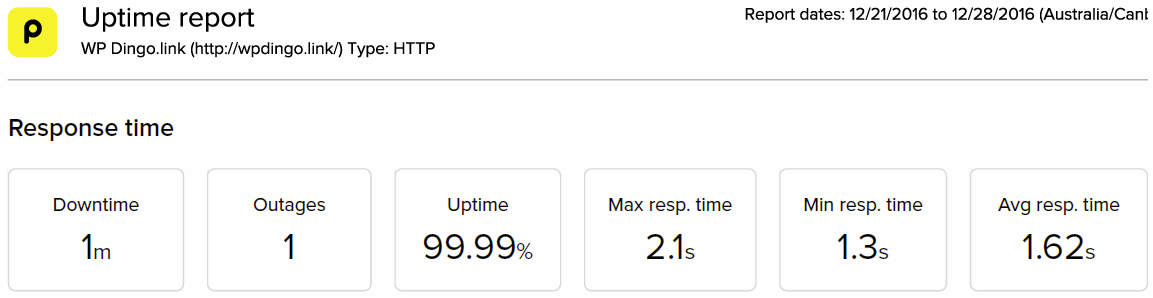

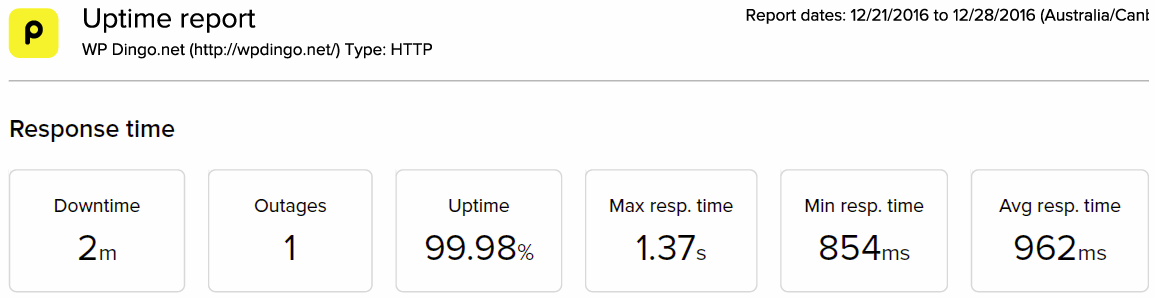
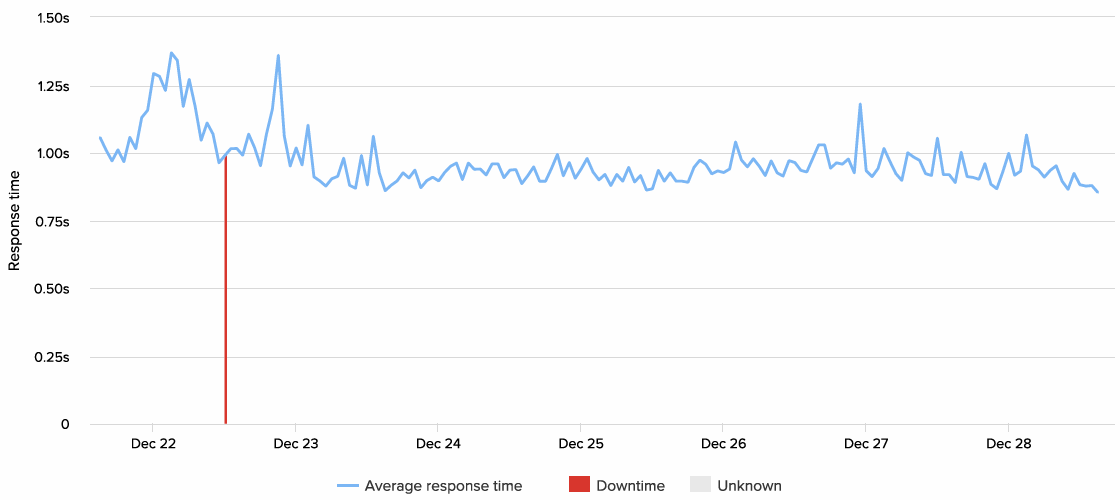
WordPress Host #7: Bluehost

WordPress Host #8: Web Hosting Hub


Uptime Test – Week 37 Summary Table
Our hosts have recorded an average uptime performance this week, with 3 hosts achieving the ultimate goal of 100% Uptime (2 hosts achieved 100% last week):
- GoDaddy
- DreamHost
- Bluehost
Unfortunately, A2 Hosting’s extremely poor uptime results have continued. After having over 3 hours of downtime 2 weeks ago, they have yet again had over 2 hours of downtime this week from 76 separate outages. This continued poor performance is very concerning, hopefully whatever is causing this will be rectified shortly.
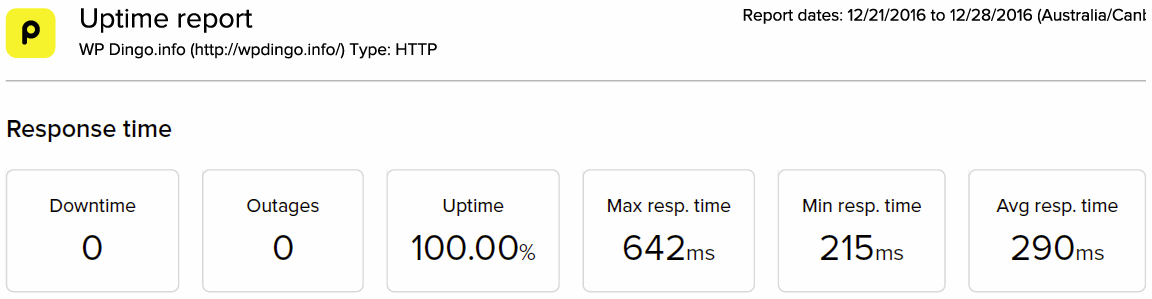
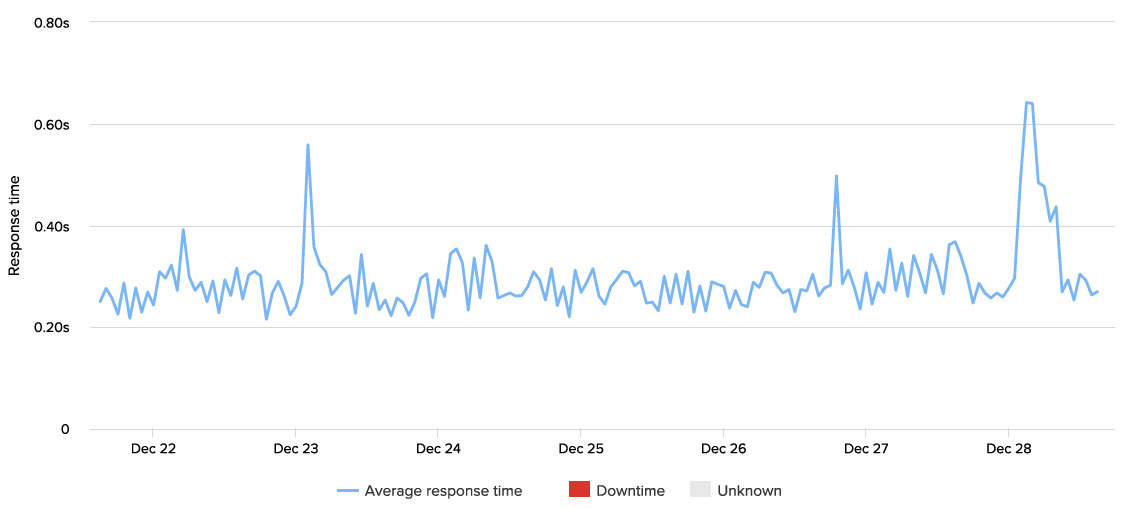
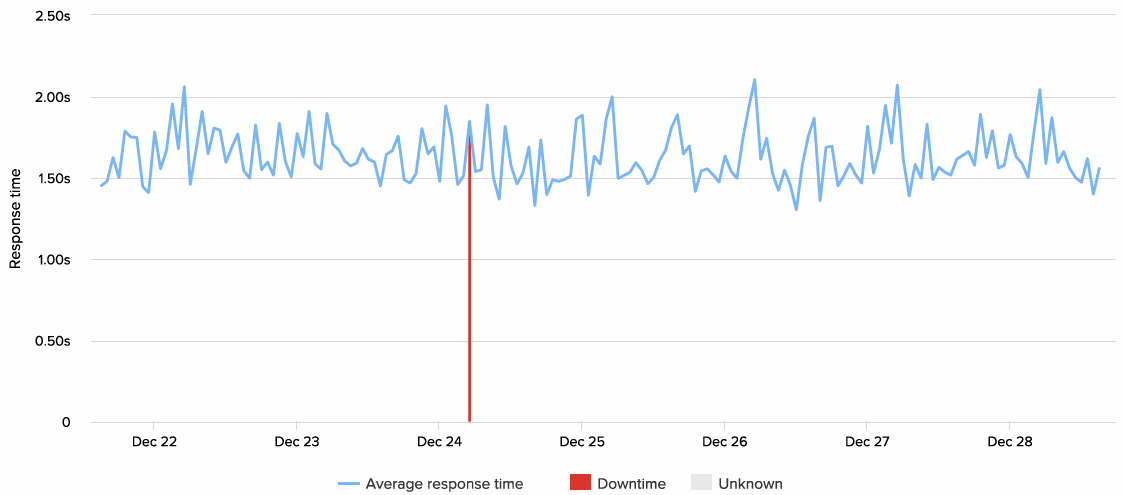
And our winner this week is GoDaddy, recording the fastest time of 290ms. The last time we ran this North America test (in Week 33 with CloudFlare and W3 Total Cache), GoDaddy’s time was quicker at 210ms.
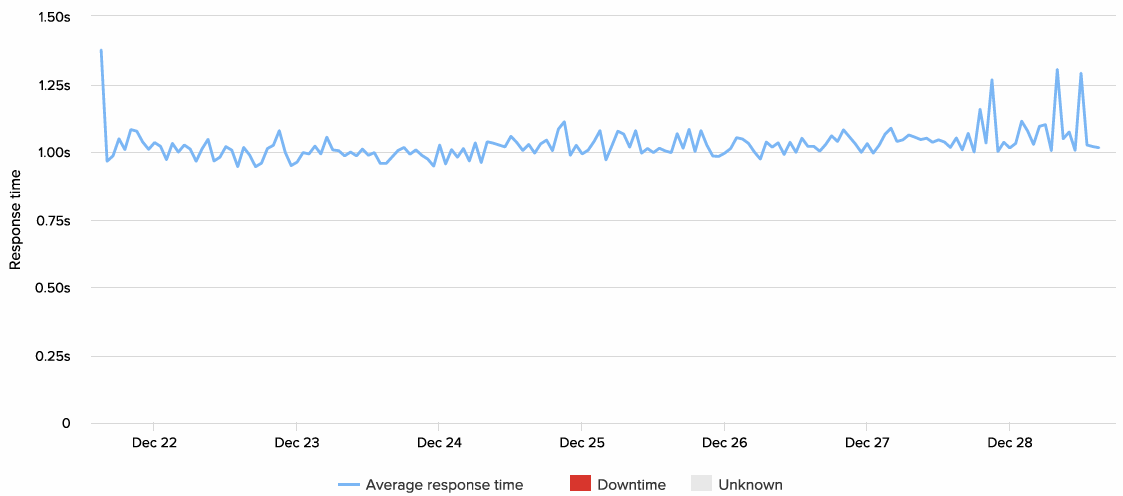
Checking in on the overall performance of changing from W3 Total Cache to WP Super Cache, the average response time across our 8 hosts in Week 33 was 961ms, while this week it has slowed even further to 1,222ms.
After 3 weeks of testing, it looks like W3 Total Cache is outperforming WP Super Cache. Let’s see if this continues into the final week?
Next week we are testing from Europe, will these slow speeds continue?

For the 3rd Week in a Row,
the Winner is…
![]()
Uptime Rankings
After 30 weeks of testing, let’s summarize all the results to see how our 8 hosts are performing overall. It will also allow us to find out which host is currently leading our uptime challenge.


 Hi, I'm Clint!


