
With WP Super Cache now added, which of our hosts are up and about this week in Asia Pacific?
Uptime Test – Week 56 Method
- Compare 8 WordPress Hosts
- Use 8 Live Sites, each with a Different Host but with Identical Content (you can check them out here)
- Use Pingdom Uptime Test
![]()
- Location of Test: 10 Asia Pacific Locations
- Frequency of Testing: Every Minute across the Last 7 Days
- Number of Weekly Tests = 1 x60 x24 x7 x8 = 80,640 (xMinutes xHours xDays xSites)
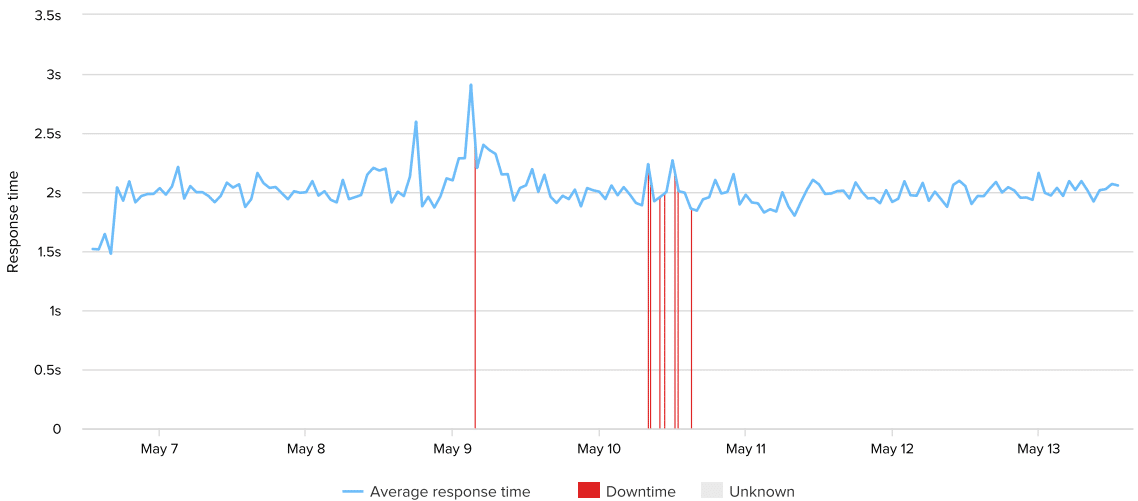
- Uptime testing is confirming that the website is actually accessible to visitors
- An example of why an outage (or downtime) can occur is scheduled maintenance of the server the website is hosted on
Which WordPress Hosts can ace the uptime test this week?
WordPress Hosts
Identical Live Sites
Weekly Tests
WordPress Host #1: SiteGround


WordPress Host #2: Namecheap

WordPress Host #3: GoDaddy

WordPress Host #4: Lightning Base

WordPress Host #5: InMotion Hosting
WordPress Host #6: HostGator


WordPress Host #7: Bluehost

WordPress Host #8: Web Hosting Hub
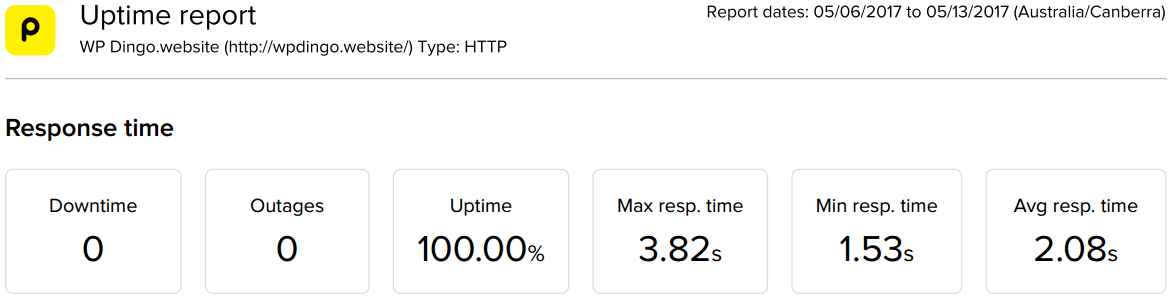
Uptime Test – Week 56 Summary Table
Our hosts have recorded an impressive uptime performance this week, with 6 hosts achieving the ultimate goal of 100% Uptime (just 1 host achieved 100% in Week 55):
- GoDaddy
- Lightning Base
- SiteGround
- Bluehost
- Namecheap
- HostGator
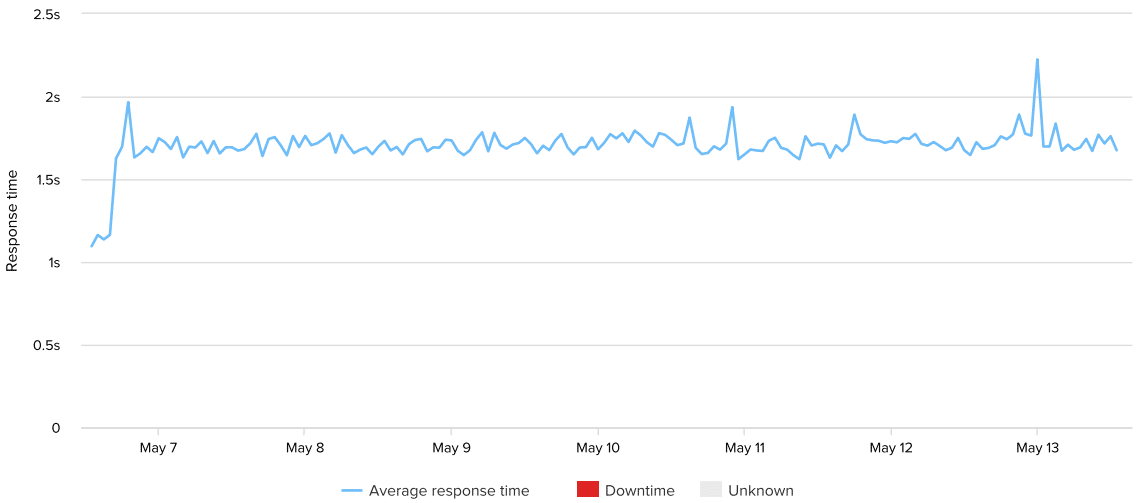
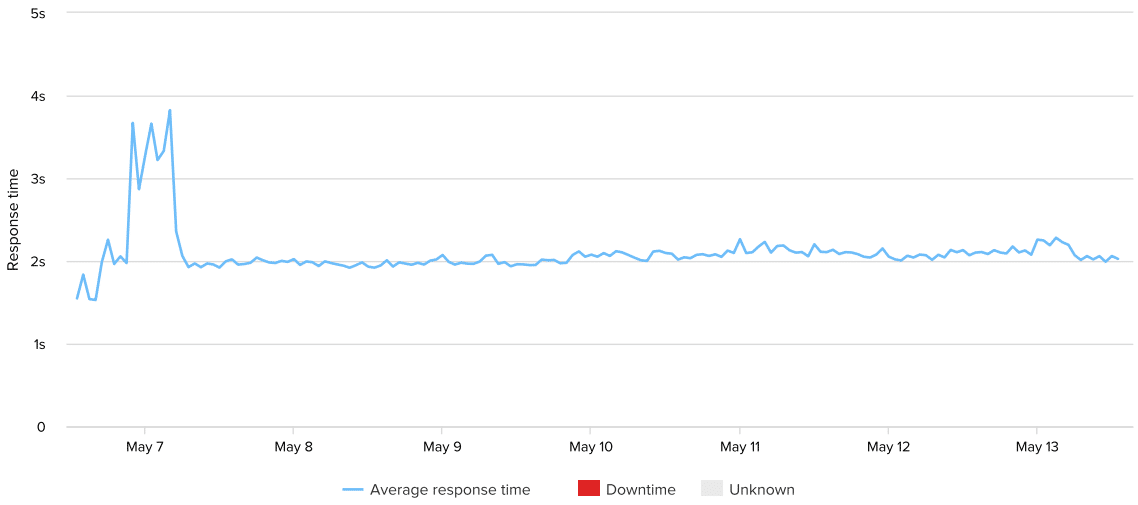
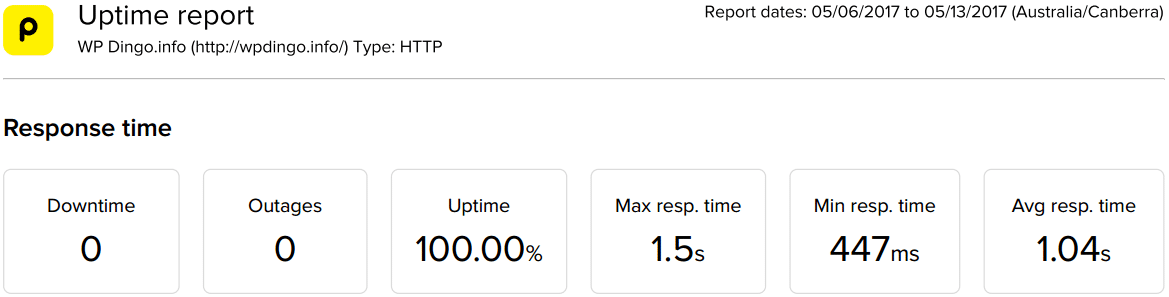
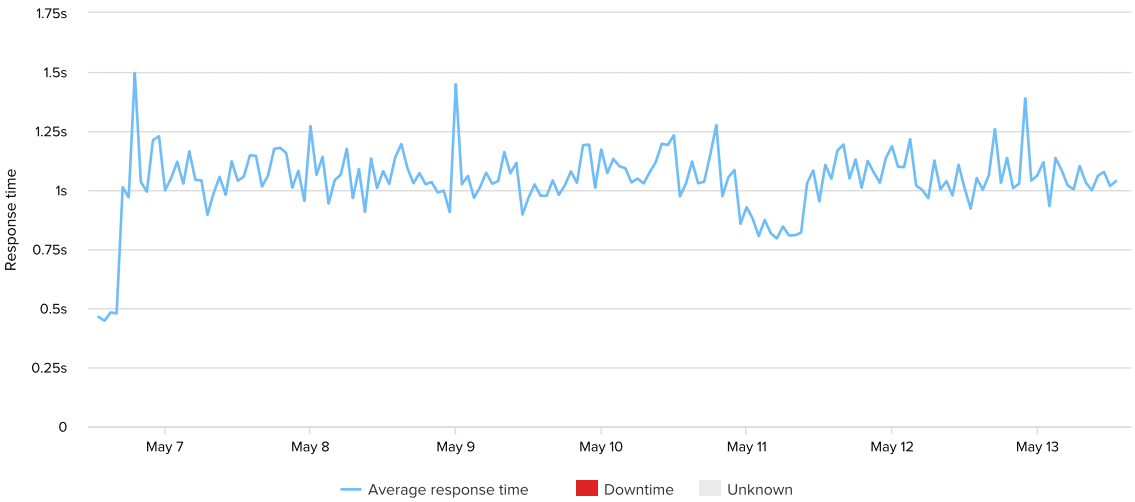
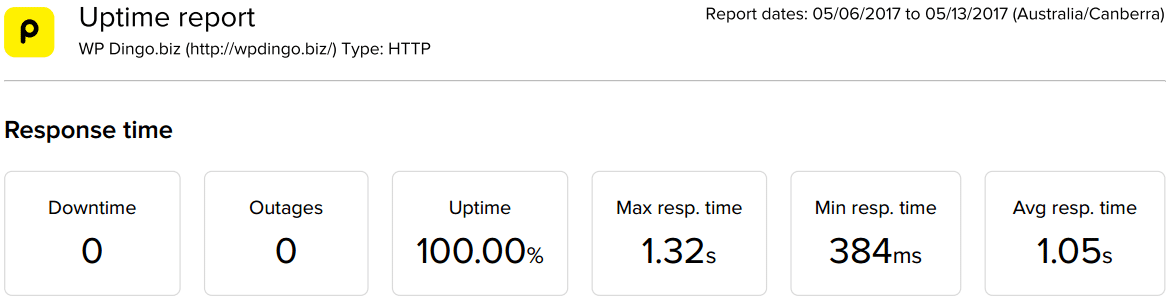
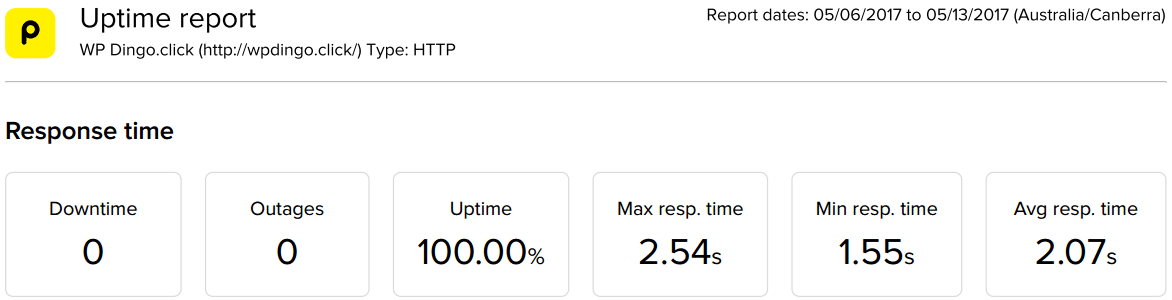
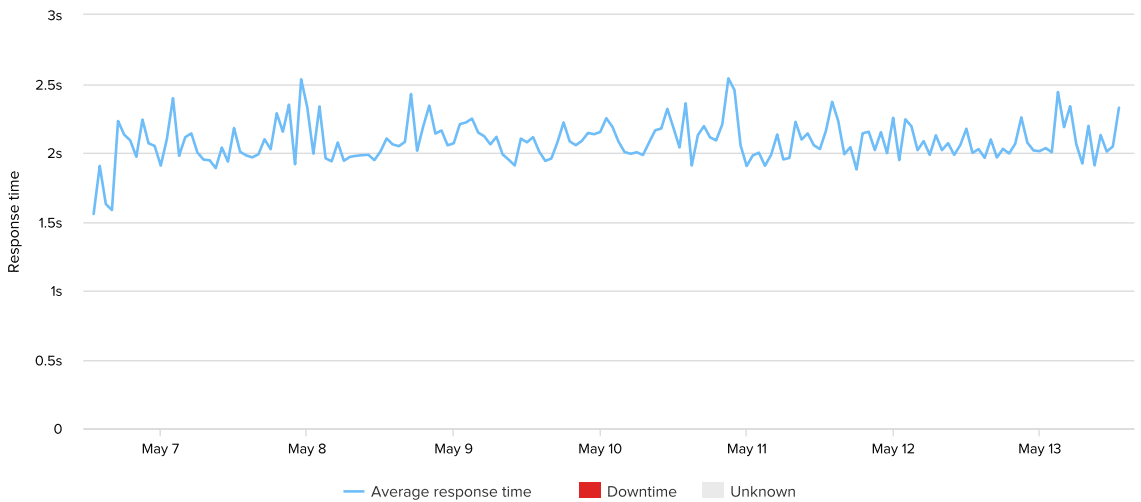
This week’s contest was really close, but as they say, there can only be one winner. And that title belongs to GoDaddy, who have just edged out Lightning Base, with a perfect uptime and the fastest response time of 1,040ms.
Checking in on the overall performance of adding WP Super Cache to ShortPixel, the average response time across our 7 hosts in Week 53 was 1,886ms, while this week it is slightly slower at 1,937ms. Note: With DreamHost just being replaced by Lightning Base, the comparison is using the other 7 hosts.
This is the third and final week of our WP Super Cache Speed Study and it looks as though there is no positive impact to response times. The impact may be more related to total load time, which we will see in the Desktop Speed Tests.
Next week we move our test to North America and a speed challenge will be thrown at a new caching plugin. I wonder how well W3 Total Cache will perform?

And for the 2nd Week in a Row
the Winner is…
![]()
Uptime Rankings
After 12 months of testing, let’s summarize all the results to see how our 8 hosts are performing overall. It will also allow us to find out which host is currently leading our uptime challenge.


 Hi, I'm Clint!


