
With Cloudflare added to WP Rocket, which of our hosts are ripping it up in Dallas?
Desktop Speed Test – Week 63 Method
- Compare 8 WordPress Hosts
- Use 8 Live Sites, each with a Different Host but with Identical Content (you can check them out here)
- Use GTmetrix Speed Test
![]()
- Location of Test: Dallas, USA
- Frequency of Testing: Every Hour for 7 Days
- Number of Weekly Tests = 1 x24 x7 x8 = 1,344 (xHours xDays xSites)
- Desktop Speed Testing is checking how long it takes for a website to fully load using a desktop internet browser
Which WordPress Host will conquer the Desktop Speed Test this week?
WordPress Hosts
Identical Live Sites
Weekly Tests
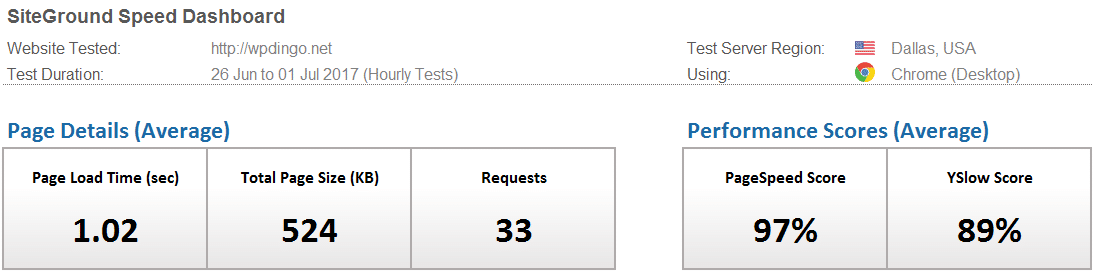
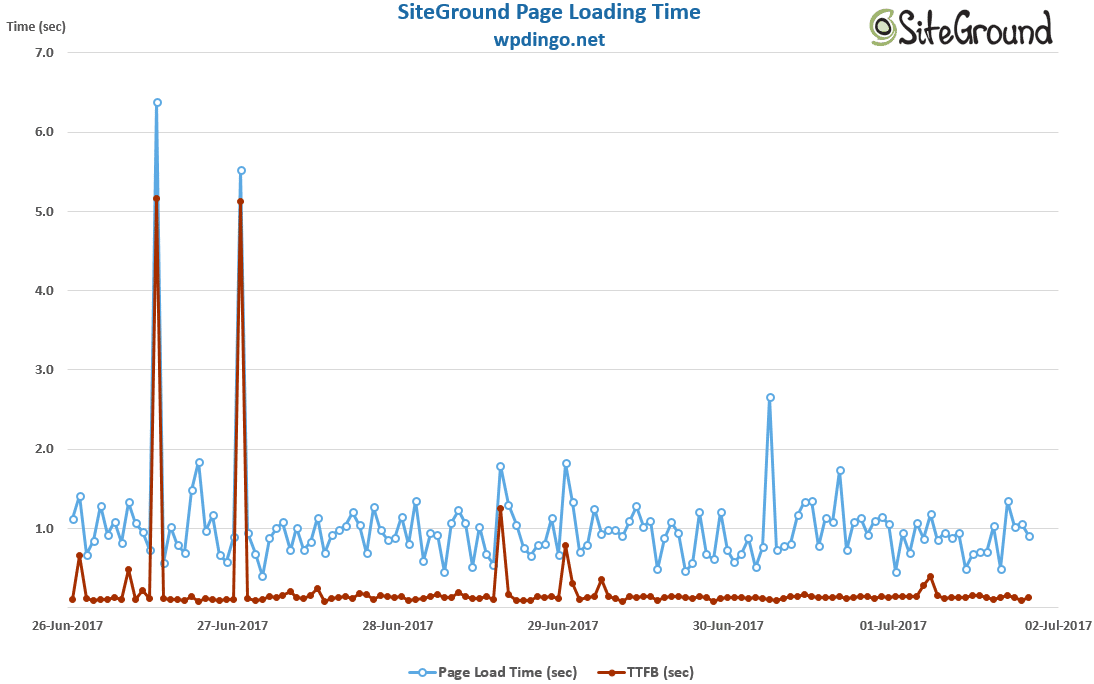
WordPress Host #1: SiteGround
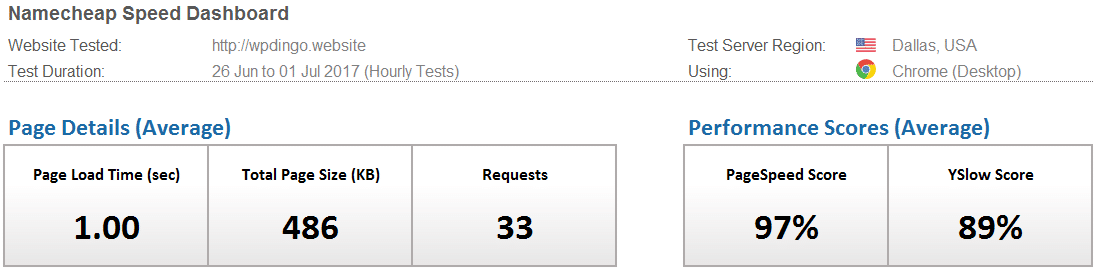
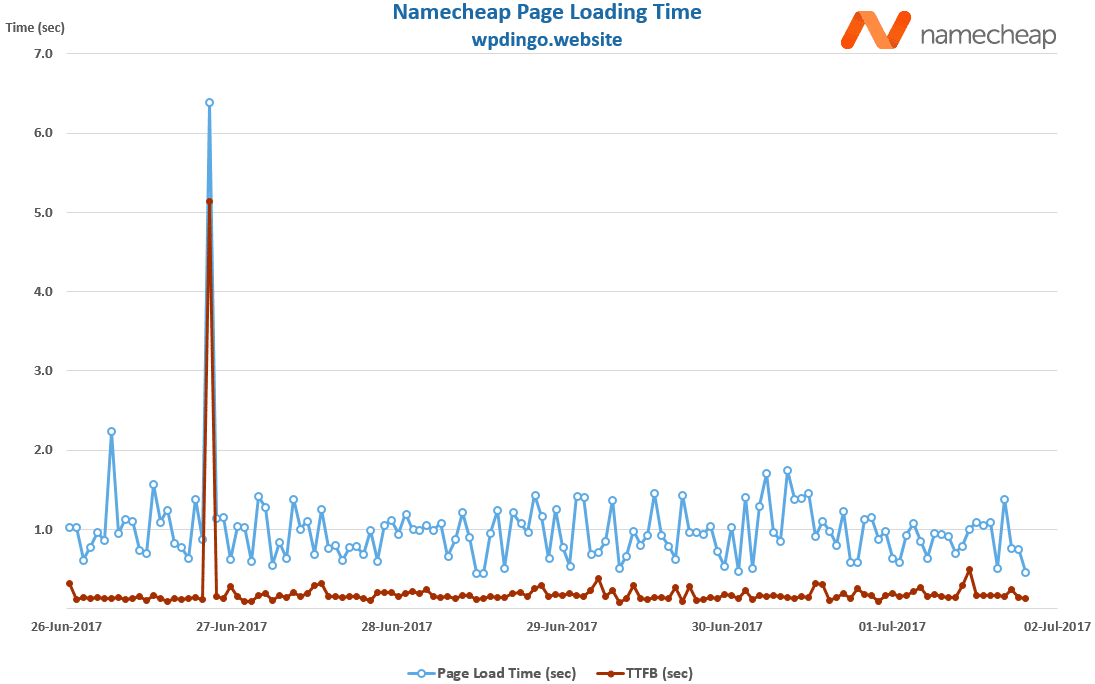
WordPress Host #2: Namecheap
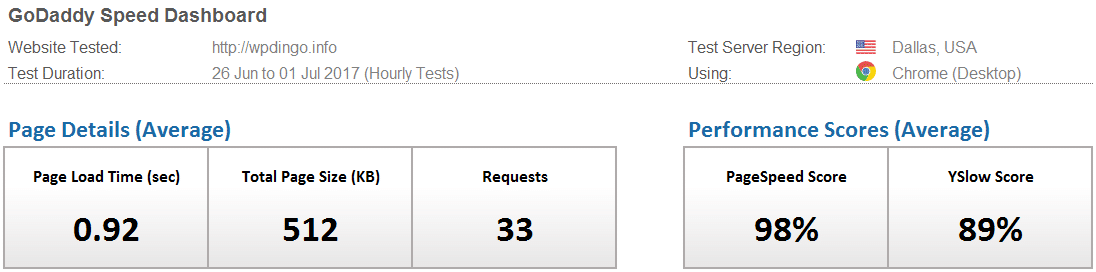
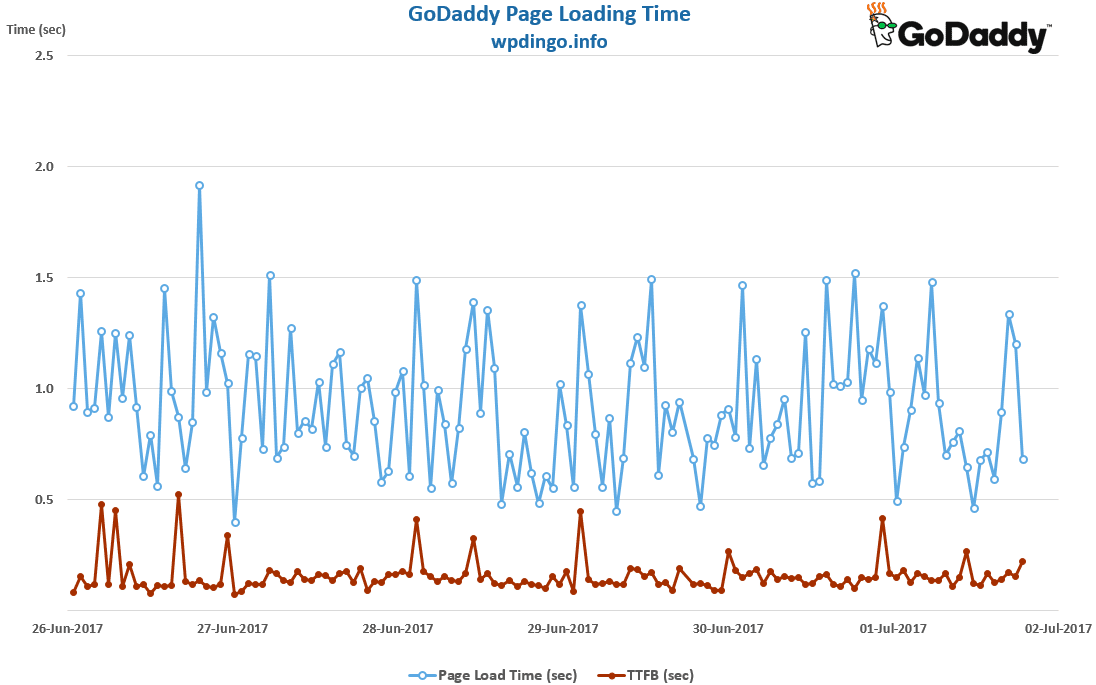
WordPress Host #3: GoDaddy
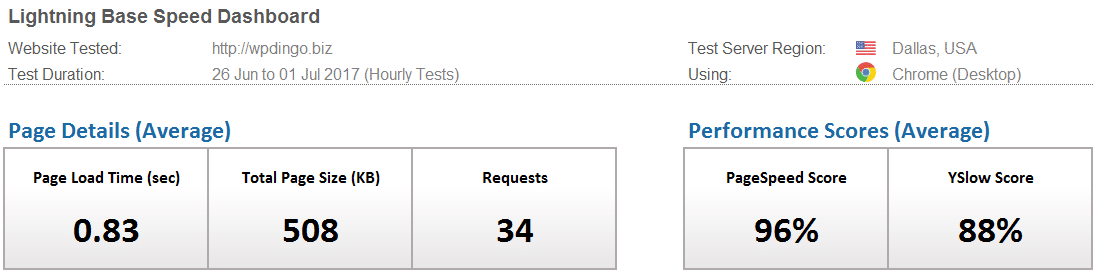
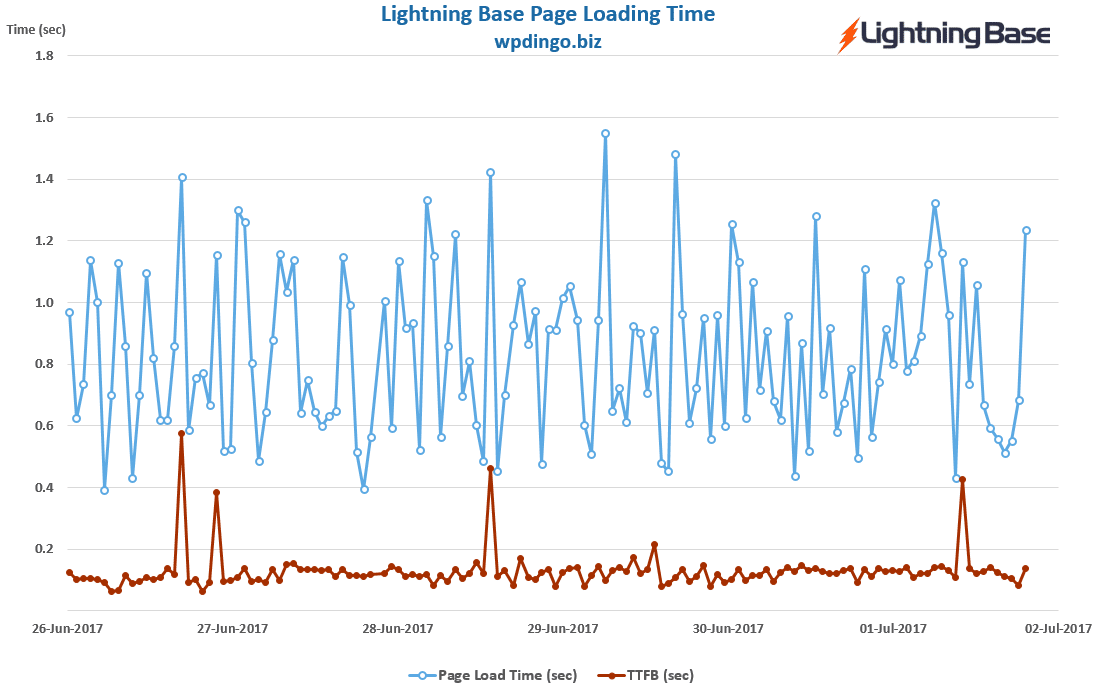
WordPress Host #4: Lightning Base
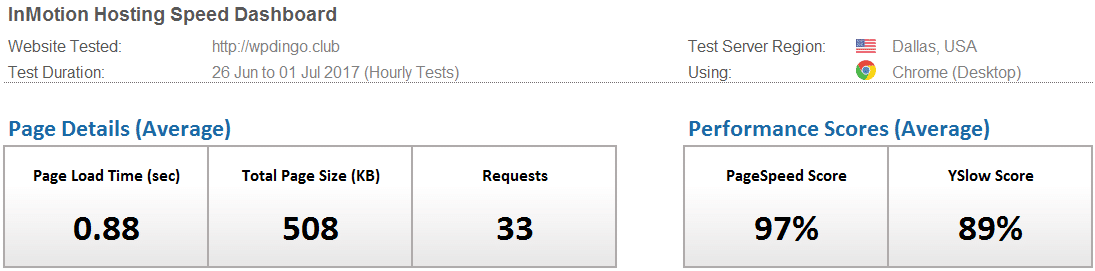
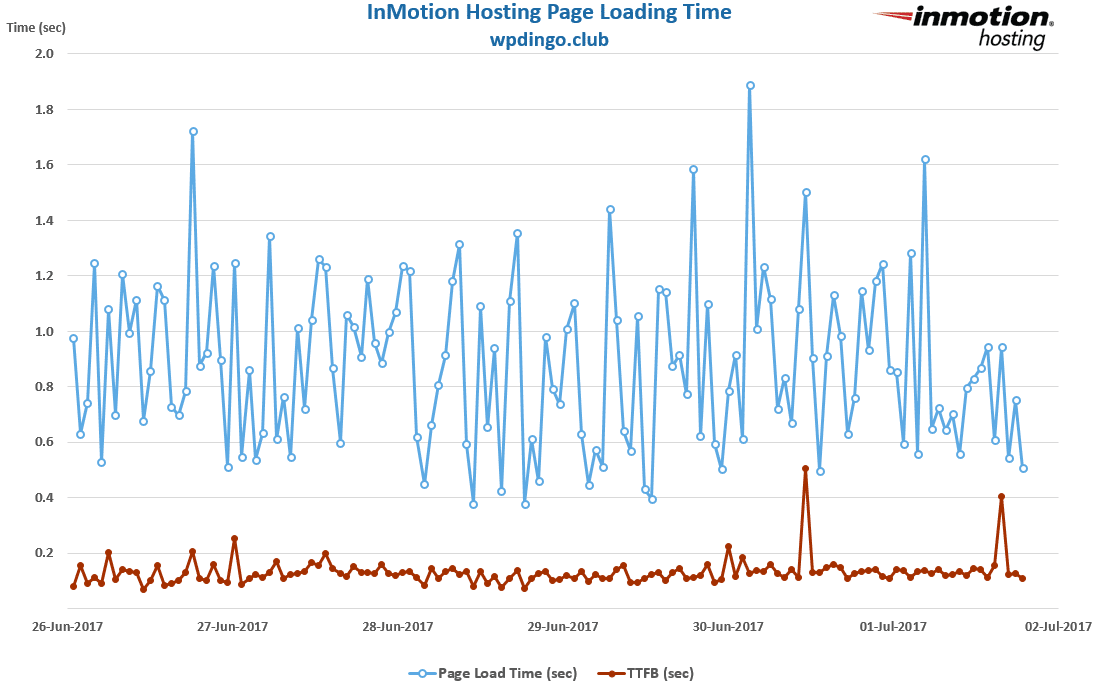
WordPress Host #5: InMotion Hosting
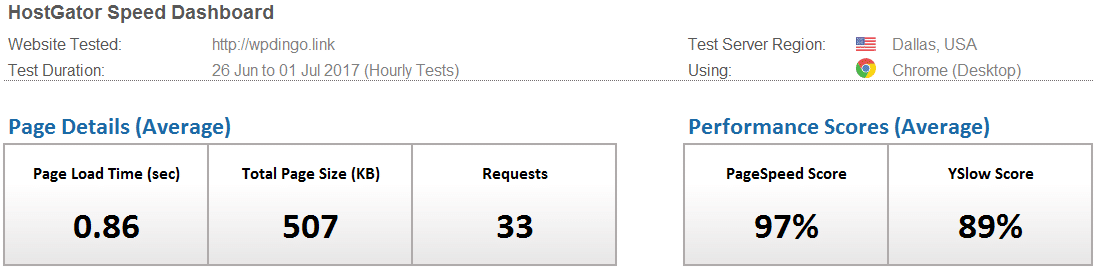
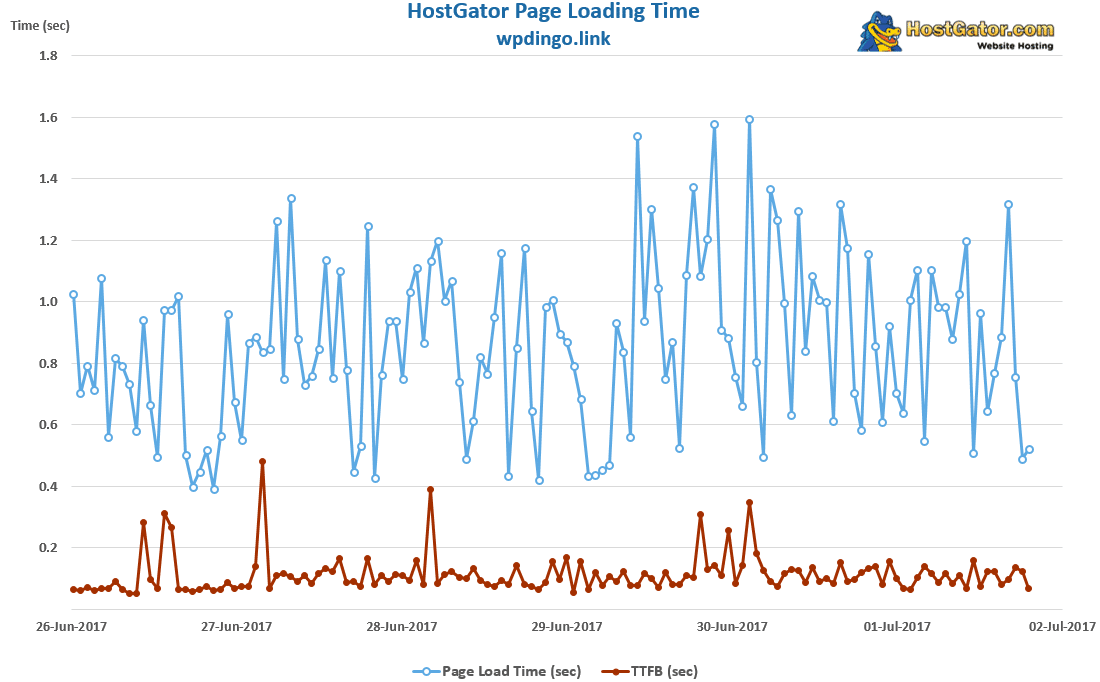
WordPress Host #6: HostGator
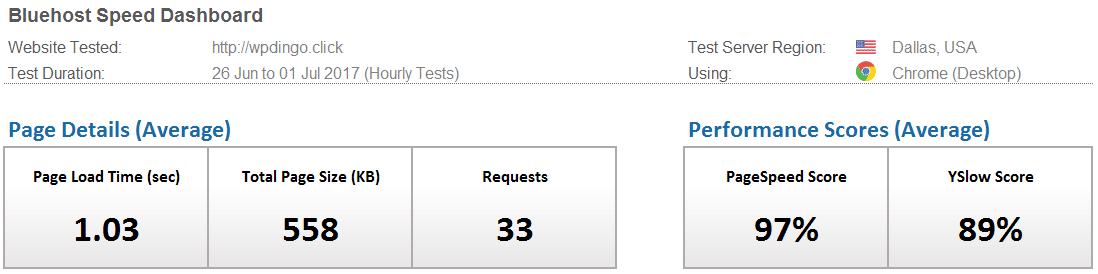
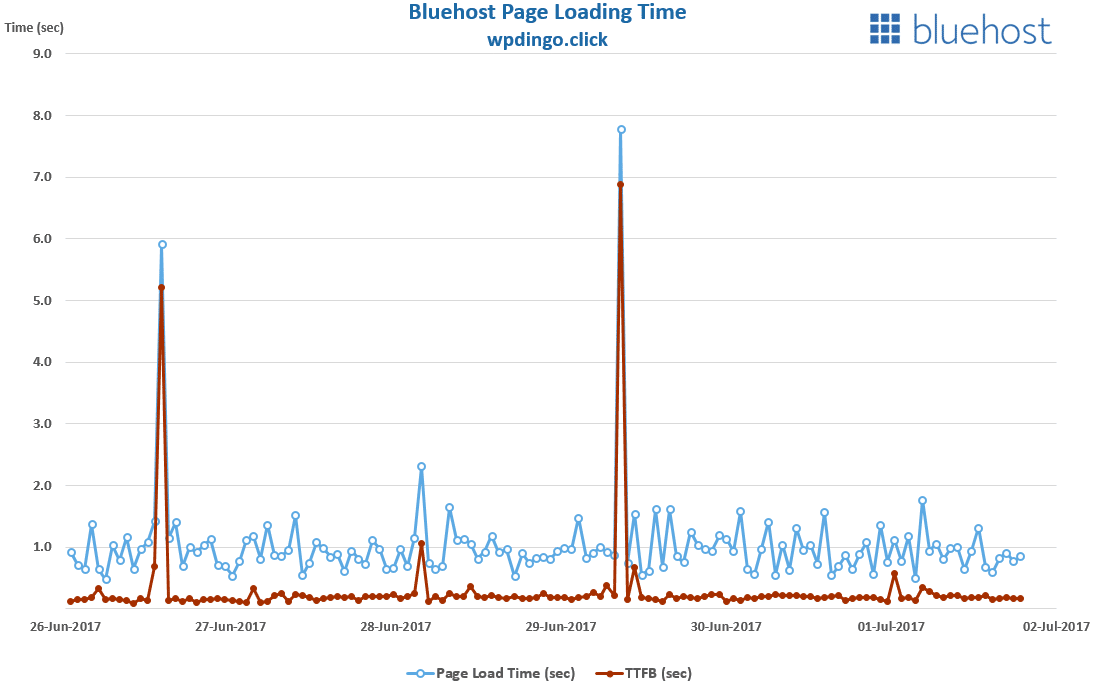
WordPress Host #7: Bluehost
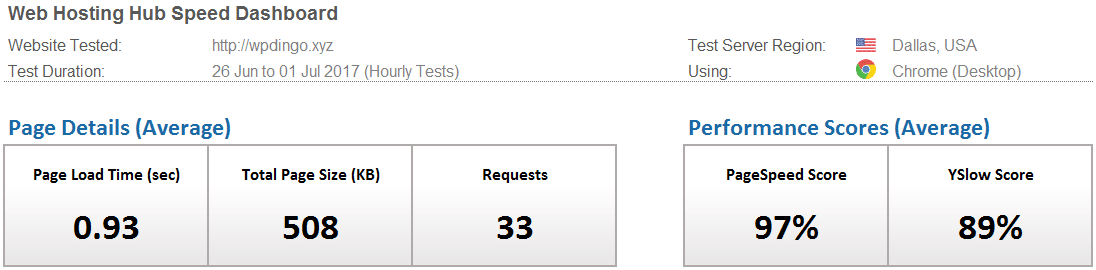
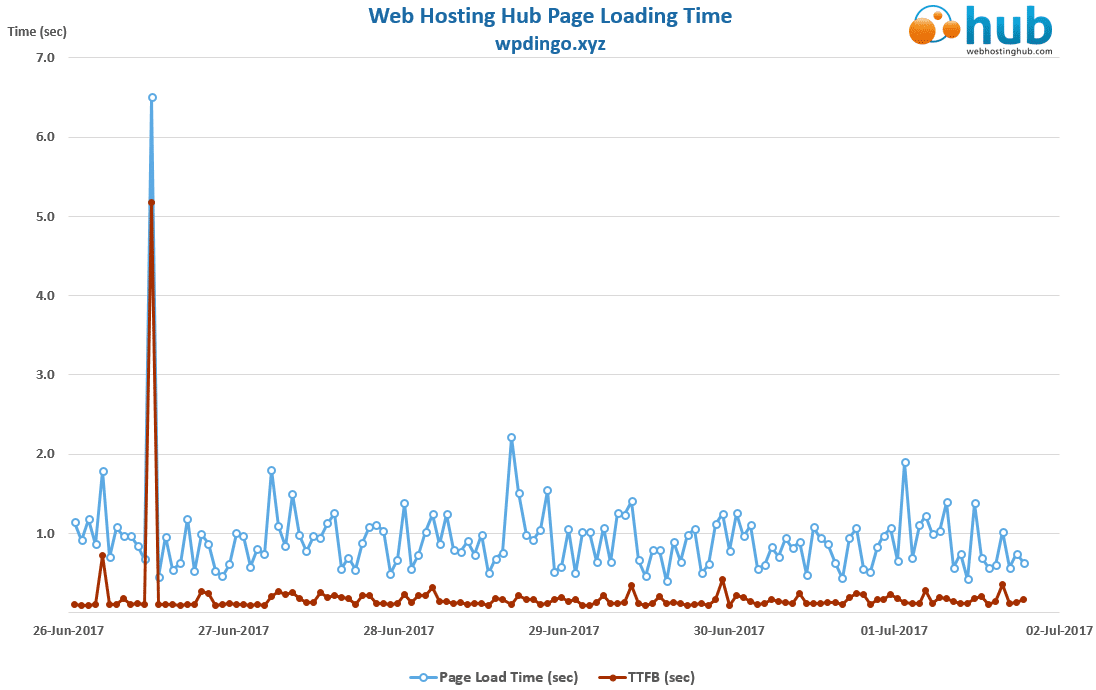
WordPress Host #8: Web Hosting Hub
Desktop Speed Test – Week 63 Summary Table
The winner this week is Lightning Base with a time of 0.83s, which breaks the Dallas record of 0.92s, that was also set by Lightning Base in Week 60. This sustained speed is very impressive – hats off to Lightning Base!!
On our last visit to Dallas with WP Rocket setup (in Week 60), the average load time for our 8 hosts was 1.07s. This week with Cloudflare added to WP Rocket, the average load time is noticeably faster at 0.93s.
This is the first week of our Cloudflare & WP Rocket Speed Study, and its looking like Cloudflare is really helping out.
Next week we’re going to head to London – will Cloudflare continue to help speed up our sites?

And the Week 63 Winner is…
![]()
Desktop Speed Rankings
After 12 months of testing, let’s summarize all the results to see how our 8 hosts are performing overall. It will also allow us to find out which host is currently leading our desktop speed challenge.


 Hi, I'm Clint!


