
With the Cloudflare & W3 Total Cache combo setup, lets check how our hosts are holding up this week in Europe?
Uptime Test – Week 70 Method
- Compare 8 WordPress Hosts
- Use 8 Live Sites, each with a Different Host but with Identical Content (you can check them out here)
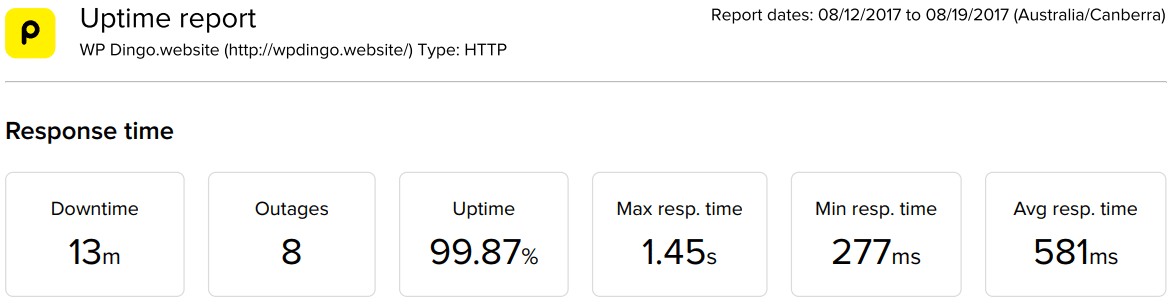
- Use Pingdom Uptime Test
![]()
- Location of Test: 10 European Locations
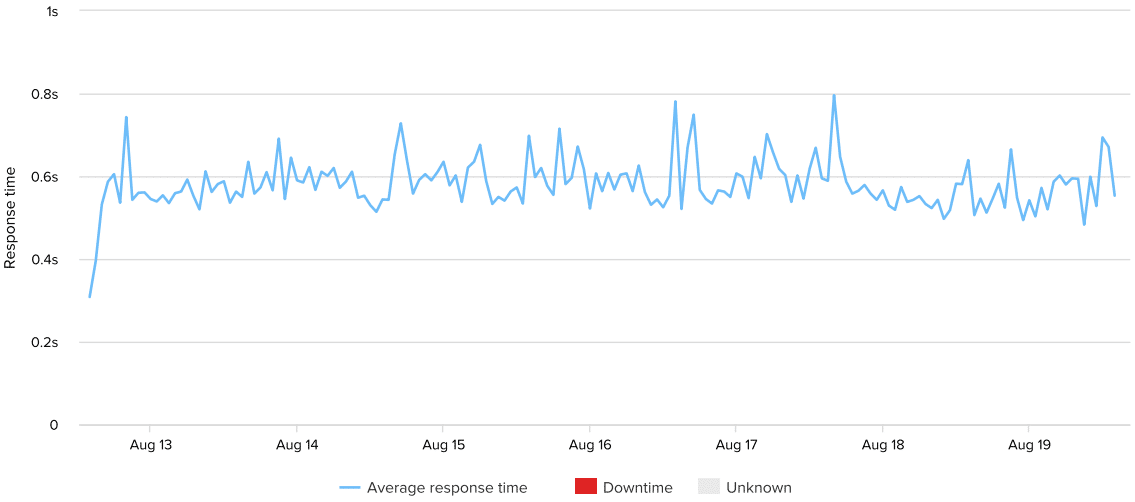
- Frequency of Testing: Every Minute across the Last 7 Days
- Number of Weekly Tests = 1 x60 x24 x7 x8 = 80,640 (xMinutes xHours xDays xSites)
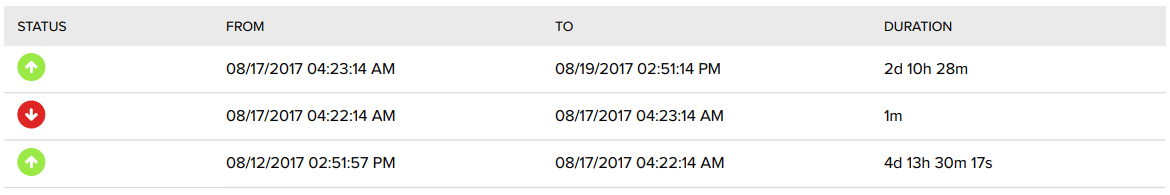
- Uptime testing is confirming that the website is actually accessible to visitors
- An example of why an outage (or downtime) can occur is scheduled maintenance of the server the website is hosted on
Which WordPress Hosts can ace the uptime test this week?
WordPress Hosts
Identical Live Sites
Weekly Tests
WordPress Host #1: SiteGround


WordPress Host #2: Namecheap
WordPress Host #3: GoDaddy


WordPress Host #4: Lightning Base

WordPress Host #5: InMotion Hosting
WordPress Host #6: HostGator
WordPress Host #7: Bluehost

WordPress Host #8: Web Hosting Hub

Uptime Test – Week 70 Summary Table
Our hosts have recorded an average uptime performance this week, with 4 hosts achieving the ultimate goal of 100% Uptime (3 hosts achieved 100% in Week 69):
- Lightning Base
- SiteGround
- Bluehost
- Web Hosting Hub
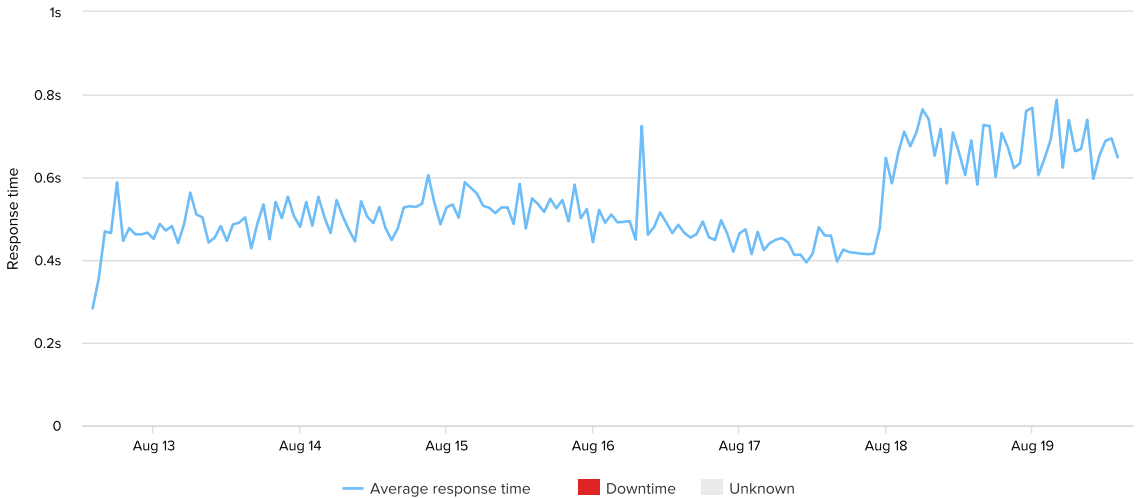
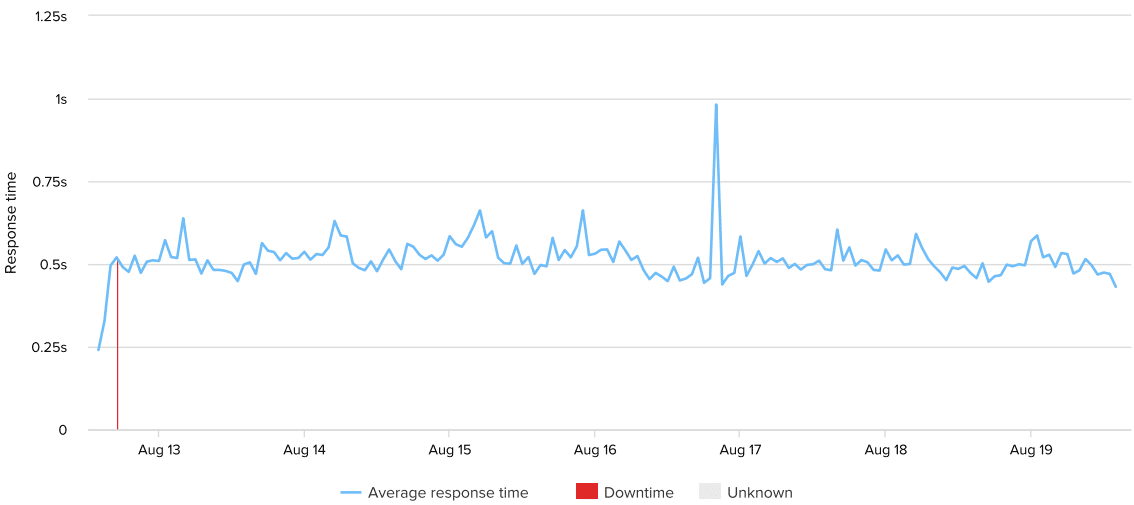
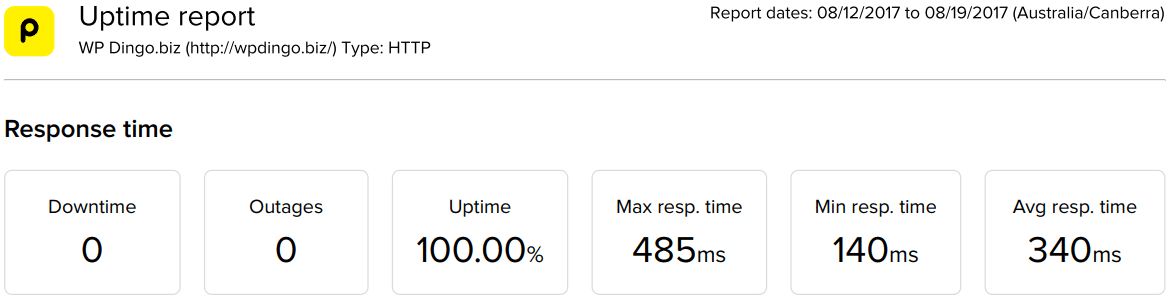
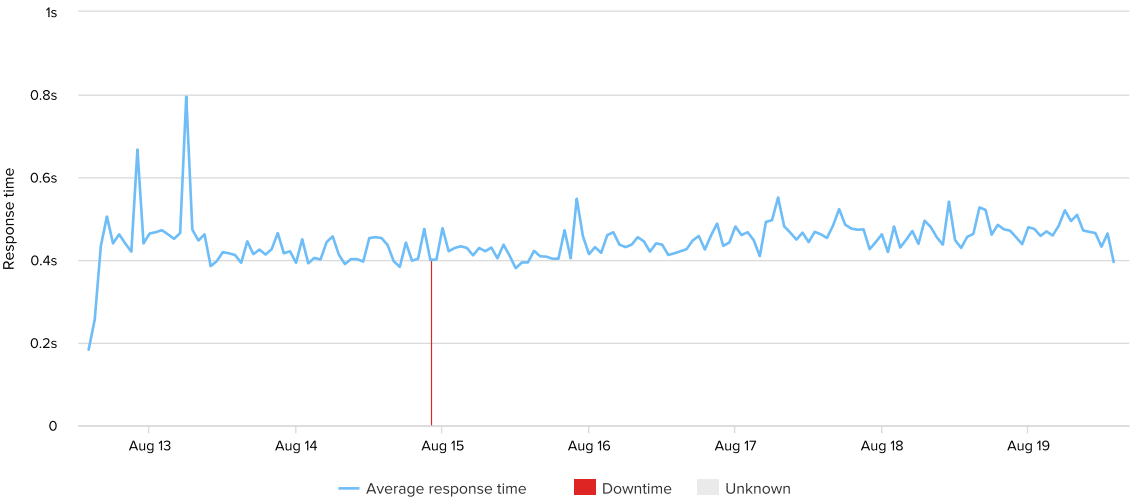
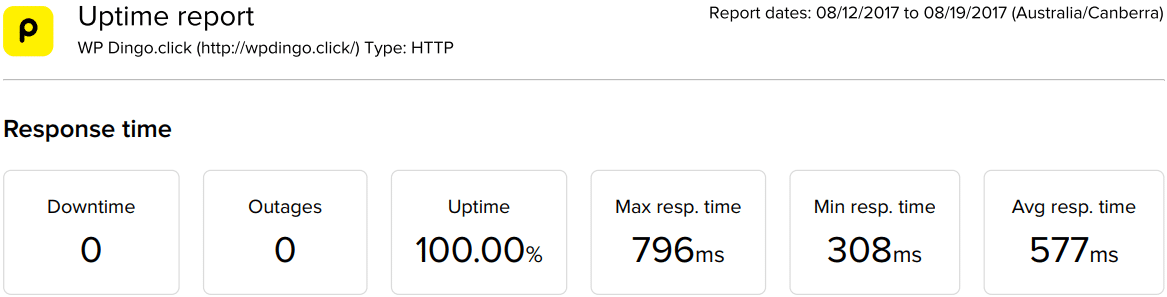
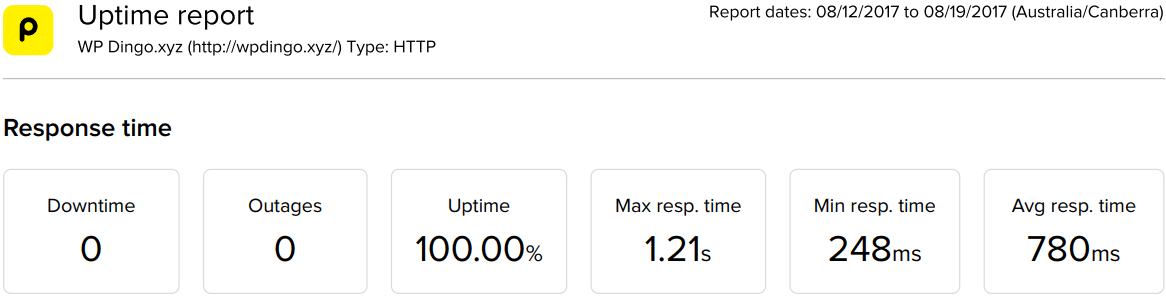
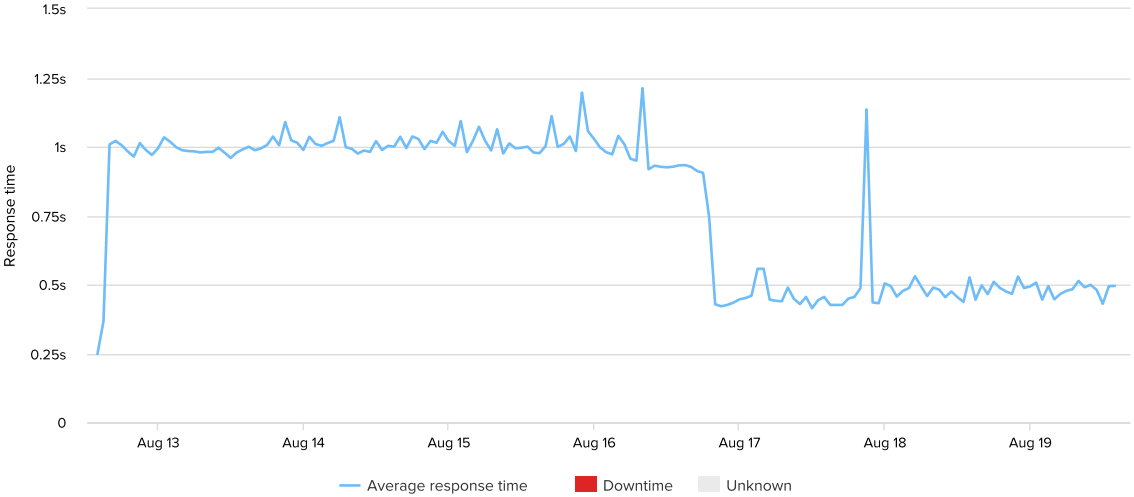
This week’s best performer in Europe is Lightning Base, with a perfect uptime and the fastest average response time of 340ms.
The last time we tested from Europe with Cloudflare & WP Super Cache setup (in Week 67), the average response time across our 8 hosts was 1,243ms, while this week with Cloudflare & W3 Total Cache it is significantly faster at 522ms.
This is the second week of our Cloudflare & W3 Total Cache Speed Study and W3 Total Cache seems to be blowing away WP Super Cache when it comes to response times.
Next week we will change up our test location to Asia Pacific, will W3 Total Cache continue this dominance?

And for the 8th Week in a Row
the Winner is…
![]()
Uptime Rankings
After 12 months of testing, let’s summarize all the results to see how our 8 hosts are performing overall. It will also allow us to find out which host is currently leading our uptime challenge.


 Hi, I'm Clint!


